

Swydo alternatives are marketing reporting platforms that replace or exceed Swydo in automated dashboard creation, cross-channel data integration, and client-ready report delivery. Alternatives to Swydo range from comprehensive SEO suites to specialized reporting tools that address limitations in pricing structure, integration depth, and advanced analytics capabilities.
Swydo is a marketing reporting platform that provides automated PDF report generation, drag-and-drop dashboard builders, and multi-channel data consolidation through integrations (Google Ads, Facebook Ads, Google Analytics). Swydo centralizes campaign performance tracking across advertising platforms without extensive technical setup.
Swydo reviews highlight pricing complexity through per-data-source billing, limited AI-powered insights, missing metrics from advertising platforms, and data accuracy inconsistencies that lead agencies to seek alternatives.
Swydo pricing starts with a base plan at $69/month that includes 10 data sources as of December 2025. Additional data sources cost $4.50 each for 11 to 100 sources, $3 each for 101 to 500 sources, and $2 each for 501+ sources. Unlimited users and clients are included, but costs scale rapidly with client count because each client typically requires multiple data source connections (Google Ads account, Meta profile, GA4 property).
The best Swydo alternatives in 2025 are Search Atlas, AgencyAnalytics, and DashThis, which stand out for unified SEO automation, comprehensive client management features, and predictable pricing structures without per-source charges.å
What are the Best Swydo Alternatives?
The 36 best Swydo alternatives are listed below.
| # | Swydo Alternative | Best For (from title) | Price (Starting) |
|---|---|---|---|
| 1 | Search Atlas | Best Swydo Alternative | $99 / month |
| 2 | AgencyAnalytics | Best Swydo Alternative for All-in-One Client Reporting | $79 / month |
| 3 | DashThis | Best Swydo Alternative for Simple Marketing Dashboards | $49 / month |
| 4 | Supermetrics | Best Swydo Alternative for Data Pipelines & Spreadsheet Reporting | $29 / source / month |
| 5 | Adverity | Best Swydo Alternative for Enterprise Data Unification | Custom (≈ $500+/month) |
| 6 | NinjaCat | Best Swydo Alternative for Multi-Channel Agency Reporting | Quote-based (≈ $999+/month) |
| 7 | TapClicks | Best Swydo Alternative for Cross-Channel Marketing Operations | $99 / month (modules extra) |
| 8 | Databox | Best Swydo Alternative for Real-Time KPI Dashboards | $47 / month |
| 9 | Whatagraph | Best Swydo Alternative for White-Labeled Visual Reports | $286 / month |
| 10 | Funnel.io | Best Swydo Alternative for Marketing Data Integration | Custom (≈ $1,000+/month) |
| 11 | ReportGarden | Best Swydo Alternative for PPC & SEO Client Reports | $75 / month |
| 12 | Octoboard | Best Swydo Alternative for Automated Web & Social Dashboards | $18 / month |
| 13 | Reportei | Best Swydo Alternative for Fast Multi-Channel Reporting Templates | $29 / month |
| 14 | Better Reports | Best Swydo Alternative for Ecommerce Analytics Reporting | $19.90 / month |
| 15 | Metrics Watch | Best Swydo Alternative for Email-Delivered Reports | $49 / month |
| 16 | Reporting Ninja | Best Swydo Alternative for Google Ads & GSC Reporting | $20 / month |
| 17 | Reportz | Best Swydo Alternative for SEO Agency Dashboards | $29.82 / month |
| 18 | Windsor.ai | Best Swydo Alternative for Multi-Touch Attribution Reporting | Free / $23+ per month |
| 19 | Improvado | Best Swydo Alternative for Enterprise Marketing Analytics | Custom (≈ $30k+/year) |
| 20 | Semrush | Best Swydo Alternative for Complete Marketing Insights | $139.95 / month |
| 21 | Looker Studio | Best Swydo Alternative for Custom Reporting | Free |
| 22 | Tableau | Best Swydo Alternative for Advanced Visual Analytics | $75 / user / month |
| 23 | Power BI | Best Swydo Alternative for Enterprise-Grade Reporting | Free / $10 per user |
| 24 | Klipfolio | Best Swydo Alternative for Modular KPI Dashboards | $140 / month |
| 25 | Porter Metrics | Best Swydo Alternative for GA4 & GSC Connectors | Free / $15+ per month |
| 26 | Grow.com | Best Swydo Alternative for Business KPI Visualization | Custom (≈ $50+/month) |
| 27 | Geckoboard | Best Swydo Alternative for Real-Time Team Dashboards | $29 / month |
| 28 | Adsbot | Best Swydo Alternative for Automated PPC Monitoring | $99 / month |
| 29 | HubSpot Marketing Hub | Best Swydo Alternative for CRM-Linked Reporting | €10 / seat / month |
| 30 | Similarweb | Best Swydo Alternative for Competitor Traffic Insights | $125 / month |
| 31 | Ahrefs | Best Swydo Alternative for Link & Keyword SEO Reporting | $129 / month |
| 32 | SE Ranking | Best Swydo Alternative for Rank Tracking Reports | $65 / month |
| 33 | SpyFu | Best Swydo Alternative for Competitor PPC & SEO Reporting | $39 / month |
| 34 | Crayon | Best Swydo Alternative for Competitor Intelligence Dashboards | Custom (≈ $30k+/year) |
| 35 | Kompyte | Best Swydo Alternative for Automated Competitive Monitoring | Custom (≈ $20k+/year) |
| 36 | Zoho Analytics | Best Swydo Alternative for Zoho-Based Reporting | $24 / month |
1. Search Atlas: Best Swydo Alternative
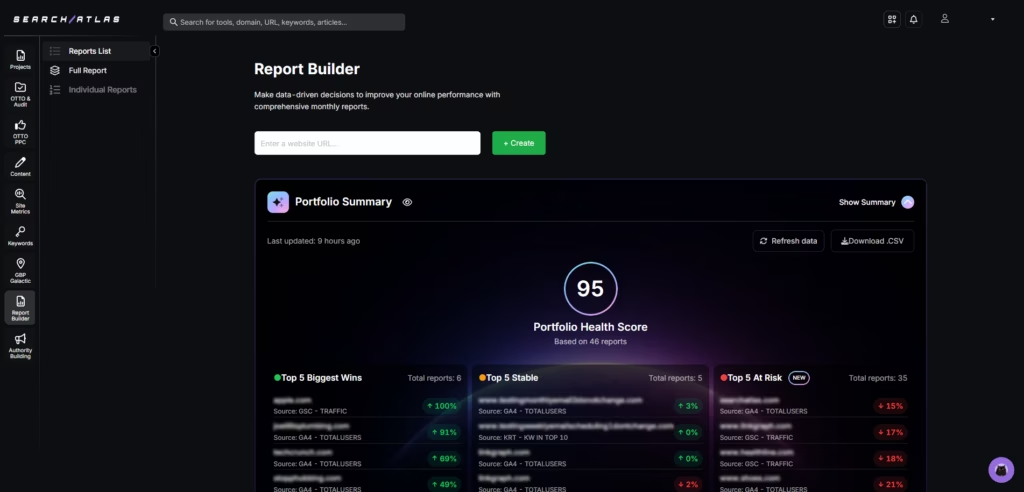
Search Atlas SEO platform is the best Swydo alternative. Search Atlas ranks as the number 1 alternative to Swydo for agencies, marketers, and enterprises that need real-time SEO dashboards, OTTO AI automation, technical optimization, and comprehensive reporting without data-source restrictions or fragmented tools.
Search Atlas Report Builder integrates live data from Google Analytics 4 (GA4), Google Search Console (GSC), Google Business Profile (GBP), and keyword rank tracking to provide transparent performance scoring that agencies use to prioritize actions. Search Atlas Report Builder includes Portfolio Summary, which categorizes accounts into wins, stable, and at-risk segments. Search Atlas delivers executive keyword growth reports, rank volatility monitoring, device-specific performance analysis, and ROI breakdowns in unified dashboards.
Agencies instantly export portfolio data, use client-friendly layouts, and share branded reports without the credit limits or per-source charges that restrict Swydo users. Search Atlas includes OTTO SEO agent automation, which executes schema fixes, Core Web Vitals improvements, and internal linking optimizations that Swydo cannot perform.
Search Atlas local SEO dashboards, AI search visibility monitoring, and backlink tracking expand reporting beyond marketing metrics into full SEO performance management (keyword research, competitor analysis, technical audits).
Search Atlas pricing starts at $99/month for Starter (1 site, 1 OTTO SEO activation), scales to $199 for Growth (2 OTTO SEO activations), reaches $399 for Pro (4 OTTO SEO activations), and offers custom Enterprise plans with unlimited users.
Search Atlas costs $30 more per month than Swydo base pricing ($99 vs $69), but eliminates separate rank tracking and technical tool costs that would add $50 to $200 monthly, resulting in overall savings of $20 to $170 per month compared to using Swydo plus external SEO tools.
The pros highlighted in the Search Atlas review include unified reporting across all SEO functions, automation for technical and on-page optimization, unlimited dashboards and exports, and comprehensive client-ready deliverables.
The con of Search Atlas is a learning curve for agencies with complex portfolios, but users consistently value the accuracy, automation depth, and reporting clarity that exceed template-based tools.
2. AgencyAnalytics: Best Swydo Alternative for All-in-One Client Reporting
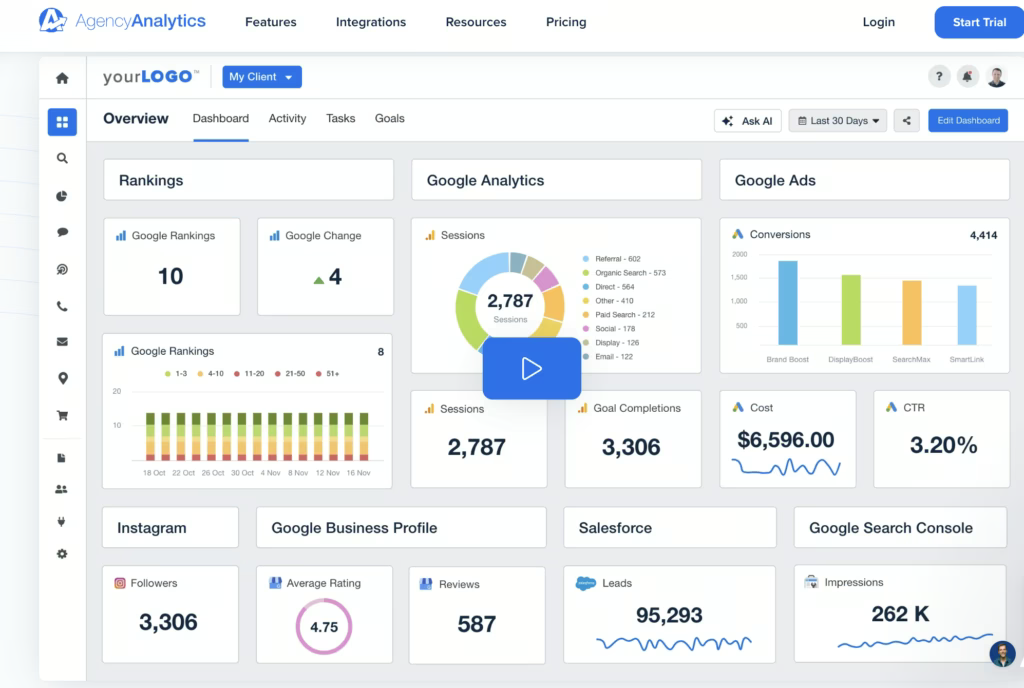
AgencyAnalytics is the best Swydo alternative for all-in-one client reporting with integrated SEO tools and marketing dashboard management. AgencyAnalytics is a marketing reporting platform that combines cross-channel data visualization, built-in SEO capabilities (rank tracking, backlink monitoring, site audits), and white-labeled client portals that matter because agencies need consolidated tool stacks without managing multiple subscriptions.
AgencyAnalytics offers 80+ integrations (Google Ads, Facebook Ads, LinkedIn Ads, Google Analytics, Search Console, social media platforms), drag-and-drop dashboard builders, automated report scheduling, and customizable widgets.
AgencyAnalytics provides native SEO tools that Swydo lacks, including daily rank tracking for unlimited keywords, backlink analysis powered by Majestic data, automated weekly site audits that flag 44 technical issues (duplicate content, broken links, missing ALT text), and call tracking integration.
Compared to Swydo, which focuses exclusively on data aggregation and PDF generation, AgencyAnalytics combines reporting with active SEO monitoring and client management infrastructure. Agencies use AgencyAnalytics to track rankings, monitor backlinks, and generate performance reports in one platform, whereas Swydo users must pair the tool with separate SEO software.
AgencyAnalytics pricing starts at $79/month for Freelancer (5-client), $239/month for Agency (10-client with enhanced features), and $479/month for Agency Pro (20-client with API access, advanced customization, and premium integrations).
The per-client pricing structure makes AgencyAnalytics approximately $10 more expensive than the Swydo base plan, but cheaper than combining Swydo with external SEO tools (Swydo $69 + rank tracker $50 + backlink tool $50 = $169).
The advantages mentioned in the AgencyAnalytics review include excellent customer support with fast response times, an intuitive interface for onboarding non-technical clients, comprehensive built-in SEO capabilities, and white-label branding on all plans.
The disadvantages of AgencyAnalytics are client minimums on each tier that force upgrades for growing agencies, limited customization on lower plans, API access restricted to Agency Pro, and costs that scale rapidly with client count.
3. DashThis: Best Swydo Alternative for Simple Marketing Dashboards
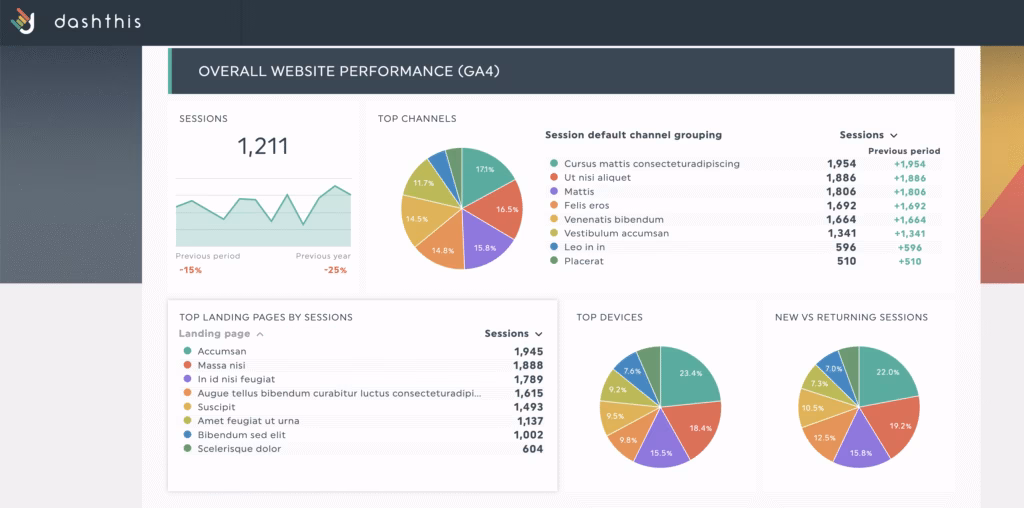
DashThis is the best Swydo alternative for simple automated agency reports with template-based setup and predictable dashboard pricing. DashThis is a marketing reporting platform built for freelancers and small agencies that need quick, branded dashboards without complex data modeling or extensive configuration time.
DashThis offers 30+ marketing integrations (Google Ads, Facebook Ads, Google Analytics, Google Search Console, Instagram, LinkedIn, Microsoft Ads, TikTok), CSV uploads for custom data, pre-set templates for SEO, PPC (pay-per-click), social media, and ecommerce, drag-and-drop dashboard builders, and automated email or PDF delivery.
White-label branding includes custom domains, themes, and client-facing portals. All plans include unlimited users and unlimited data sources, which eliminates the per-source billing model that complicates Swydo costs.
Compared to Swydo, DashThis prioritizes speed and simplicity over advanced customization. Swydo provides more extensive widget options and data blending capabilities, while DashThis reduces setup time through standardized templates. Agencies managing straightforward client reporting workflows (monthly performance summaries, campaign overviews) find DashThis faster to deploy, while Swydo better accommodates clients requiring detailed metric manipulation or custom calculated fields.
DashThis pricing starts at $49/month for 3 dashboards, $159/month for 10 dashboards, $309/month for 25 dashboards, and $479/month for 50 dashboards.
The dashboard-based pricing provides cost predictability. A small agency managing 10 clients pays $159/month regardless of data source count. The Swydo equivalent scenario (10 clients with 3 sources each: 30 sources) costs $69/month base plus $90 additional sources ($4.50 × 20), totaling $159/month.
The benefits mentioned in the DashThis review include fast setup with minimal training required, unlimited users and integrations on every plan, reliable white-label features that maintain agency branding, and clean dashboard templates that clients understand without guidance.
The downsides of DashThis are limited integrations compared to comprehensive platforms (Swydo has 40+, DashThis has 30+), fragile connector stability with occasional data sync issues, weak customization for agencies requiring complex metric calculations, and rising costs when clients need multiple specialized dashboards.
4. Supermetrics: Best Swydo Alternative for Data Pipelines & Spreadsheet Reporting
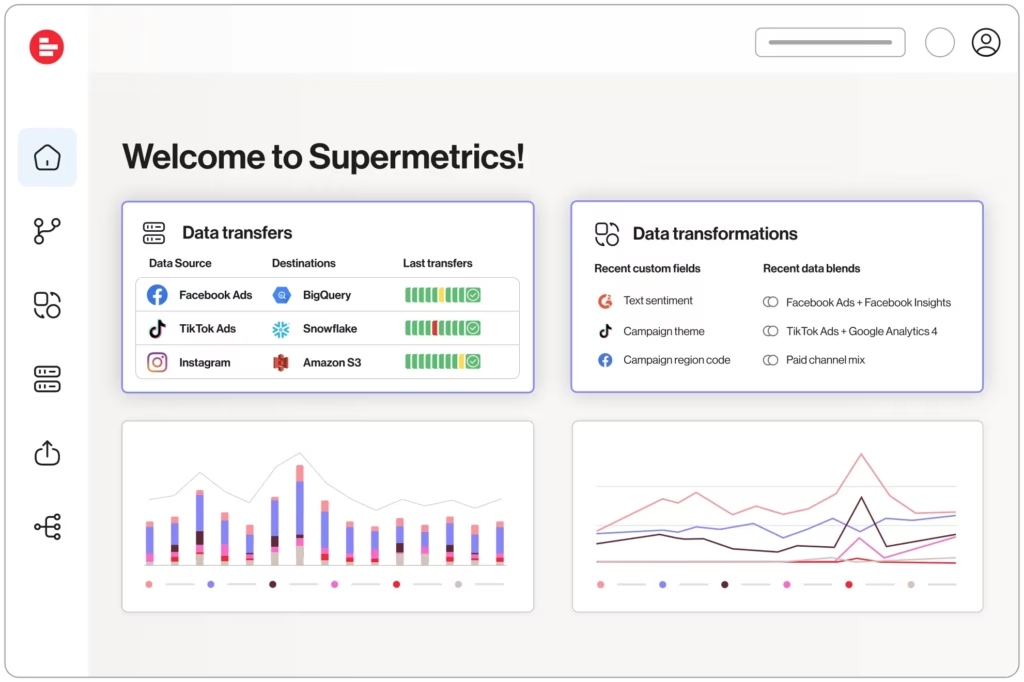
Supermetrics is the best Swydo alternative for data pipeline integration with specialized ETL (extract, transform, and load) technology and flexible destination routing. Supermetrics is a marketing data connector that extracts data from 130+ sources and delivers it to destinations (Google Sheets, Excel, Looker Studio, Power BI, BigQuery, Snowflake) without providing native visualization or reporting infrastructure.
Supermetrics functions as middleware between data sources and analysis tools, which means users operate a two-tool workflow with Supermetrics handling extraction and separate BI (Business intelligence) platforms providing visualization. Supermetrics offers historical data backfills, scheduled refresh automation, custom API query builders, and data transformation options.
Compared to Swydo, which combines data extraction with dashboard creation in one platform, Supermetrics delivers raw data control but requires pairing with external visualization tools (additional cost, configuration complexity, vendor management).
Agencies using Supermetrics build custom analysis environments in Google Sheets or Data Studio, maintain complete data ownership without proprietary formatting, and export to data warehouses for advanced modeling.
Swydo users receive pre-built dashboard templates and automated PDF delivery without spreadsheet management. Supermetrics caters to data-savvy teams that want maximum control, while Swydo prioritizes client-ready outputs with minimal configuration.
Supermetrics pricing starts at $29/month per data source for Google Sheets, Excel, Looker Studio, or Power BI destinations. Data warehouse destinations (BigQuery, Snowflake, Azure, Redshift) require higher-tier plans with custom pricing.
Agencies managing multiple clients face costs ranging from $600 to $1,200/month, depending on source count, destination type, and refresh frequency. Swydo starts at $69/month with unlimited sources after base allocation, which makes Supermetrics significantly more expensive at scale but offers deeper data pipeline control.
The pros in the Supermetrics review include wide integration coverage across advertising, analytics, and social platforms, flexible ETL pipelines that accommodate custom workflows, historical data retrieval for trend analysis, and compatibility with major BI tools (Looker Studio, Power BI, Tableau, Qlik).
The cons of Supermetrics are high pricing when managing many sources, limited built-in visualization requiring external platforms, reliance on separate BI (Business Intelligence) subscriptions that increase total cost, and steeper learning curves compared to turnkey solutions.
5. Adverity: Best Swydo Alternative for Enterprise Data Unification
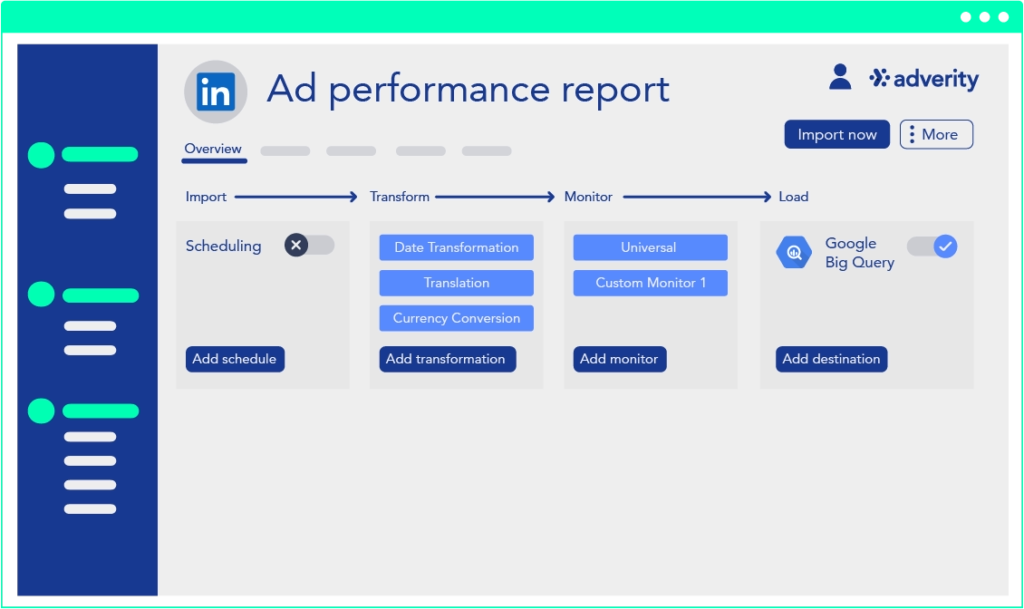
Adverity is the best Swydo alternative for enterprise data unification with robust ETL infrastructure and data warehouse integration. Adverity is a marketing data platform that automates the extraction, transformation, and loading of data from 600+ sources into centralized warehouses (BigQuery, Snowflake, Redshift, Azure Synapse), governance frameworks, and quality validation systems that matter because enterprises require industrial-strength pipelines with compliance controls.
Adverity provides automated data connectors across advertising, analytics, social, CRM, and ecommerce platforms, no-code transformation builders with data mapping and naming conventions, automated data quality monitoring with anomaly detection, role-based access controls for team governance, and data lineage tracking for audit requirements.
Adverity focuses on building scalable data pipelines that feed enterprise BI tools (Tableau, Power BI, Looker) rather than creating client-facing dashboards directly.
Compared to Swydo, which provides all-in-one workflows where data extraction, transformation, and visualization occur in one platform, Adverity focuses exclusively on robust data pipeline creation that feeds separate visualization tools.
Swydo delivers turnkey PDF reports and dashboards, while Adverity enables enterprises to build custom analytics environments with data engineering teams. Agencies that need fast client reports prefer Swydo, while enterprises managing complex compliance requirements and large-scale data operations benefit from the depth of Adverity.
Adverity pricing requires custom enterprise quotes based on data volume, connector usage, and infrastructure requirements, with reported monthly costs starting at $500 to $2000 and scaling significantly higher for large deployments.
Swydo costs range from $69 to several hundred dollars monthly, depending on data sources, making Adverity significantly more expensive (minimum $6000 annually vs $828 annually for Swydo base) but targeting fundamentally different use cases (enterprise data infrastructure versus agency client reporting).
The advantages outlined in the Adverity review include a massive connector library covering specialized platforms, powerful data transformation and cleansing capabilities, reliable data warehouse integration with automated loading, enterprise-grade governance and compliance features (SOC 2, HIPAA, GDPR), and dedicated technical support for complex implementations.
The disadvantages of Adverity are prohibitively high costs for small to mid-sized businesses, a requirement for technical expertise to configure transformations and manage pipelines, a lack of a native visualization layer requiring separate BI subscriptions, a complex setup with longer deployment timelines (2+ months), and overkill complexity for teams needing simple client reporting.
6. NinjaCat: Best Swydo Alternative for Multi-Channel Agency Reporting
NinjaCat is the best Swydo alternative for multi-channel agency reporting with consolidated client management and standardized performance tracking. NinjaCat is a digital marketing analytics platform that centralizes data from 150+ advertising, analytics, and call tracking sources into unified dashboards, automated reports, and client-ready deliverables that matter because agencies need scalable workflows across large client portfolios.
NinjaCat features automated data refresh with anomaly alerts that notify teams when metrics fall outside expected ranges, and white-label client portals where clients access their own branded dashboards without agency intervention. It includes budget pacing tools that track spend against targets across campaigns, call tracking integration that connects phone conversions to digital campaigns, and workflow management tools (client notes, benchmarking, task assignments).
Agencies emphasize operational workflows and custom data management in NinjaCat, while Swydo users emphasize speed, template efficiency, and reliable basic reporting.
Compared to Swydo, NinjaCat provides deeper operational features (budget tracking, call analytics, team workflow tools) but receives criticism for connector reliability and performance on large datasets. User feedback highlights steeper learning curves and recurring data accuracy issues in NinjaCat compared to the faster loading and more stable managed integrations in Swydo.
Agencies with complex reporting needs and operational oversight requirements benefit from advanced features in NinjaCat, while those prioritizing efficient, reliable template-based reporting select Swydo.
NinjaCat pricing is quote-based and not publicly listed. Third-party reports indicate a ranges from $999 to $2,599/month for larger agencies based on client count and feature requirements. Even at the lowest tiers, NinjaCat costs at least $930 more than the Swydo base pricing ($69/month), while higher tiers cost 3 to 5 times Swydo typical configurations.
The pros listed in the NinjaCat review are a large integration library covering advertising, analytics, and call tracking platforms, white-label client portals with independent access, budget pacing and spend monitoring tools, call tracking connectivity for phone conversion attribution, and cross-client standardization for multi-account management.
The cons of NinjaCat include data accuracy issues with occasional metric discrepancies, slower performance when processing large datasets or complex queries, higher pricing that scales rapidly with client count, a steeper learning curve requiring more onboarding time, and connector reliability problems compared to Swydo stability.
7. TapClicks: Best Swydo Alternative for Cross-Channel Marketing Operations
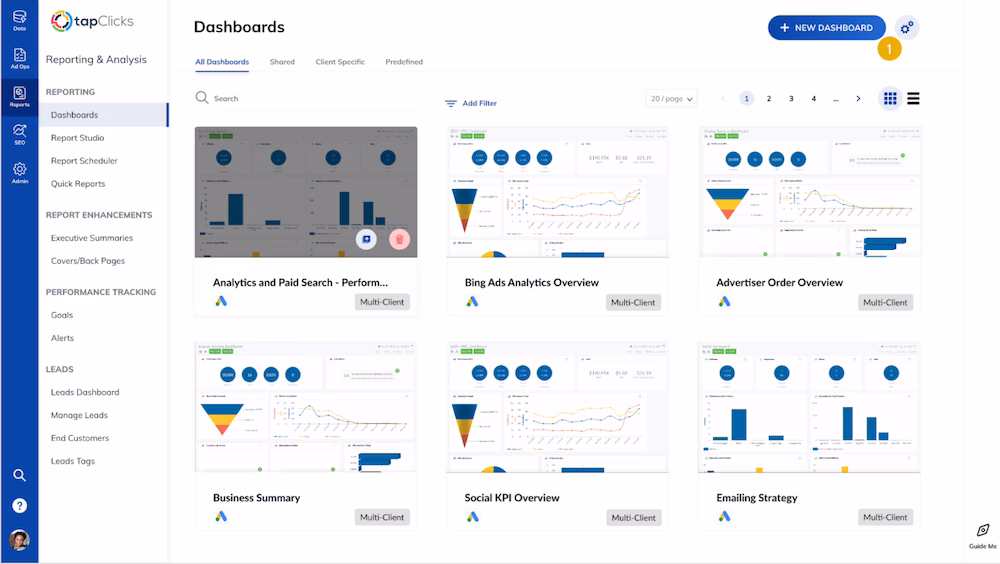
TapClicks is the best Swydo Alternative for cross-channel marketing operations with comprehensive workflow automation and order management. TapClicks is a marketing operations suite that combines data ingestion, analytics, reporting, workflow management, and campaign execution tools into modular packages (TapData, TapReports, TapAnalytics, TapInsights, TapOrders, TapWorkflow, Raven SEO, Competitive Intelligence) that matter because large agencies need unified platforms for both reporting and operational processes.
TapClicks features 250+ data connectors through its Connector Marketplace, SmartConnector technology for custom source integration, automated client reporting with scheduled delivery, AI-driven campaign recommendations through TapInsights, order management, and CRM integration for campaign fulfillment.
It has task workflow automation for team coordination, built-in SEO tools (rank tracking, site audits, backlink analysis), and competitive intelligence for local SEM data. Agencies use TapClicks to centralize disparate datasets, scale reporting for hundreds of clients, and streamline operational workflows beyond pure analytics.
Compared to Swydo, which emphasizes simplicity and fast PDF report generation, TapClicks provides greater operational depth but requires more setup investment and technical configuration.
Swydo focuses on data visualization and client deliverables, while TapClicks extends into campaign management, order processing, and team workflow orchestration. User reviews indicate TapClicks suffers from connector reliability issues, data accuracy problems, and difficult implementation despite extensive CSM support, while Swydo maintains a simpler scope with more stable basic reporting.
TapClicks pricing revolves around modular packages combining a data tier (TapDataLite, TapData+, TapData Max) with destination modules (TapReports, TapAnalytics, TapInsights). Entry pricing starts at $99/month for TapDataLite plus destination costs. For example, TapDataLite ($99) combined with TapAnalytics ($899) totals $998/month for 10 clients with unlimited users. Larger packages increase costs with additional connectors and faster refresh rates.
Swydo starts at $69/month base, which makes TapClicks approximately 20 times more expensive at the entry level for agencies managing complex operations.
The benefits in TapClicks reviews include expansive data coverage across 250+ platforms, multiple operational modules beyond reporting (workflow, orders, SEO), white-label branding throughout client interfaces, AI-driven insights for campaign optimization, and comprehensive agency management infrastructure.
The downsides of TapClicks are significantly higher costs compared to focused reporting tools, a steep learning curve requiring 6+ months of CSM support according to reviews, connector reliability issues with frequent disconnections, data accuracy problems that persist despite support intervention, and a complex setup that overwhelms teams expecting turnkey solutions.
8. Databox: Best Swydo Alternative for Real-Time KPI Dashboards
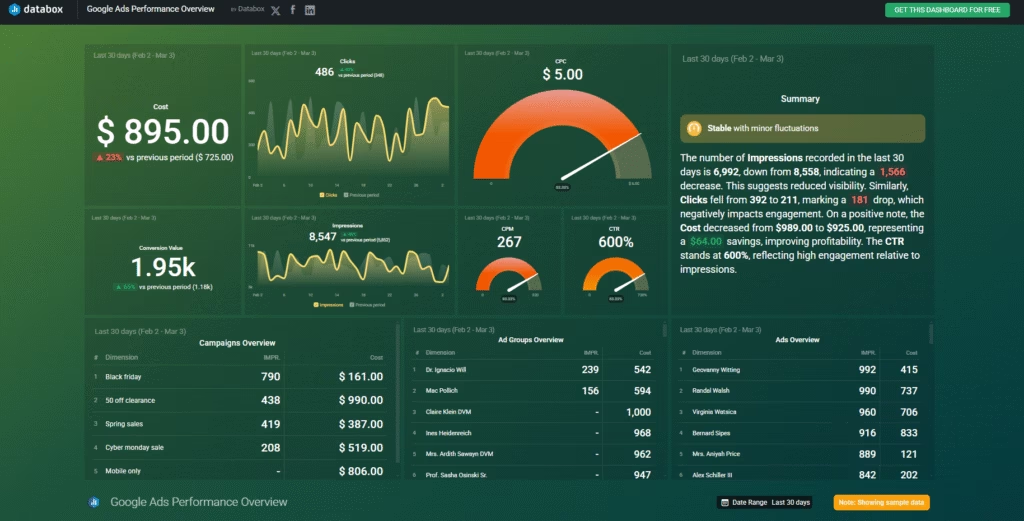
Databox is the best Swydo alternative for real-time KPI dashboards with a mobile-first design and instant performance visibility. Databox is a business intelligence platform built for agencies and in-house teams that need quick visual dashboards on web, mobile, and TV screens without investing in heavy BI infrastructure or complex reporting setups.
Databox integrates with 130+ data sources (Google Ads, Facebook Ads, Google Analytics 4, HubSpot, Salesforce, Shopify, LinkedIn Ads), offers Metric Builder for creating custom KPIs without code, and provides Datasets for cleaning and merging raw records.
Databox includes AI-powered Performance Summaries that highlight key insights, features 200+ pre-built templates for common use cases, and delivers 20+ chart types for diverse visualization needs. Databox provides automated alerts via Slack, email, or mobile app when metrics exceed thresholds, industry benchmark groups for competitive comparison, and goal tracking with progress indicators.
Compared to Swydo, Databox emphasizes mobile interactivity and fast internal monitoring, while Swydo provides broader template customization, more stable integrations, and client-focused PDF generation. Agencies that need reusable client reports, flexible branding, and reliable connectors prefer Swydo, while Databox suits teams wanting lightweight, mobile-friendly real-time tracking for internal performance monitoring.
Swydo includes unlimited data sources after base allocation, whereas Databox charges per connector, which creates cost escalation for agencies with many client accounts.
Databox pricing eliminated its free tier from July 2025. Paid plans start with Starter at $47/month (10 data sources, 3 users), Professional at $159/month (30 sources, 10 users, advanced features), Growth at $359/month (75 sources, unlimited users), and Premium at $799/month (custom sources, white-labeling, priority support).
Databox white-label branding costs an additional $250/year as a separate add-on. Costs scale by connector count rather than user count, so agencies with many accounts face higher bills. Swydo base pricing at $69/month makes Databox more expensive for multi-client agencies.
The pros highlighted in the Databox review include a polished mobile app with excellent user experience, real-time dashboard updates without manual refresh, industry benchmarking for competitive context, automated alerting through multiple channels (Slack, email, mobile), and fast setup for basic monitoring needs.
The cons of Databox are fragile connectors with frequent disconnections according to user reviews, limited customization compared to dedicated agency tools, expensive scaling as the connector count increases, inconsistent customer support with reports of slow response times, white-labeling requires an additional annual fee, and a per-connector pricing model that disadvantages agencies.
9. Whatagraph: Best Swydo Alternative for White-Labeled Visual Reports
Whatagraph is the best Swydo alternative for white-labeled visual reports with advanced data blending and interactive dashboards. Whatagraph is a marketing analytics platform that combines cross-channel data aggregation, sophisticated visualization, and automated client delivery into one system that matters because agencies need polished, branded outputs with deeper customization than template-based tools provide.
Whatagraph offers 55+ fully managed integrations (Google Ads, Facebook Ads, Google Analytics 4, LinkedIn Ads, TikTok Ads, Search Console, Shopify), drag-and-drop report builders with extensive widget libraries, and advanced data blending that combines metrics from multiple sources into unified views.
Whatagraph includes custom-calculated metrics using formulas without code, linked report templates where changes propagate across all instances, AI-powered insights through Whatagraph IQ that summarize performance trends, automated report scheduling with branded email delivery, and interactive live dashboards where clients adjust date ranges and filters independently.
Compared to Swydo, Whatagraph provides more extensive customization options, advanced data blending features, and interactive dashboards beyond static PDFs. Swydo emphasizes template speed and simplicity with drag-and-drop widgets optimized for fast implementation, while Whatagraph delivers deeper analytical capabilities and flexible branding.
Swydo pricing scales per data source, while Whatagraph uses a credit-based system for sources and destinations. Agencies prioritizing automation, scalability, and polished client-facing outputs find Whatagraph stronger, while those wanting fast template deployment prefer Swydo efficiency.
Whatagraph pricing starts at $286/month for the Start plan (20 credits, essential integrations, basic features), $579/month for the Boost plan (60 credits, white-labeling, advanced blending), and custom pricing for the Max plan (100+ credits, premium integrations, SSO). Each data source, warehouse destination, or data blend consumes credits, so costs scale with usage complexity.
Swydo base at $69/month makes Whatagraph approximately 4 times more expensive at the entry level, but Whatagraph includes unlimited templates, advanced automation, and comprehensive branding without per-source charges beyond credit allocation.
The advantages mentioned in the Whatagraph review include stable, reliable integrations with proactive data health monitoring, extensive customization for branded client deliverables, powerful data blending and calculated metrics, linked templates that save time when managing many clients, and interactive dashboards that empower clients to explore data independently.
The disadvantages of Whatagraph are higher starting costs compared to simple reporting tools, credit-based pricing that requires usage monitoring, feature complexity that creates a learning curve for basic users, and premium integrations locked behind higher tiers.
10. Funnel.io: Best Swydo Alternative for Marketing Data Integration
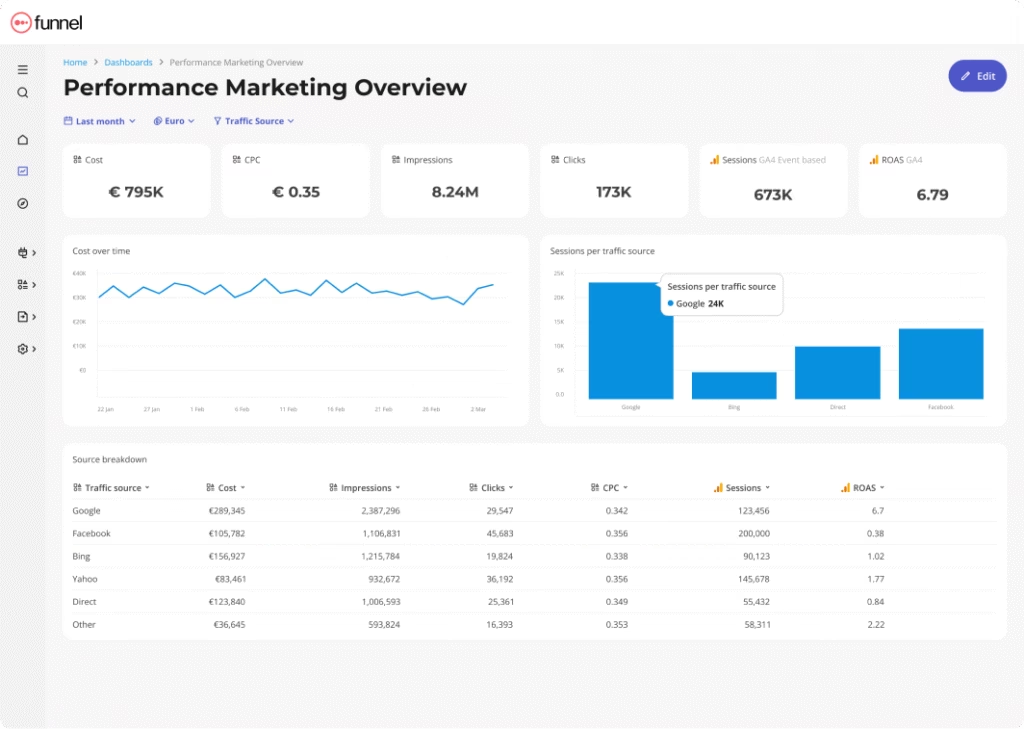
Funnel.io is the best Swydo alternative for marketing data integration with advanced ETL workflows and data warehouse connectivity. Funnel is a marketing data hub that extracts, transforms, and normalizes data from 500+ sources before exporting to BI tools (Looker Studio, Power BI, Tableau), data warehouses (BigQuery, Snowflake, Redshift), or spreadsheets (Google Sheets, Excel), which matters because data-savvy teams need clean, standardized data flows rather than pre-built dashboards.
Funnel.io provides automated data extraction with historical backfills, data mapping and naming conventions for cross-platform standardization, custom dimensions and calculated metrics, automated currency conversion for global campaigns, advanced data governance with user permissions and audit logs, API-based exports for custom integrations, and data quality monitoring.
Funnel focuses on ETL (Extract, Transform, Load) capabilities rather than visualization, so users pair it with external BI platforms for report creation.
Compared to Swydo, which combines data extraction with dashboard creation in one platform, Funnel delivers deeper data preparation but requires separate visualization tools (additional cost, setup complexity, vendor coordination).
Agencies using Funnel build custom analysis environments and maintain complete data control, while Swydo users receive integrated dashboards and automated PDF delivery without managing multiple systems. Funnel caters to enterprises with in-house BI teams that want maximum data flexibility, while Swydo prioritizes agencies needing client-ready reports quickly.
Funnel.io pricing is custom and usage-based, calculated through flexpoints that scale with connectors, destinations, and data volume. Third-party sources report starting costs around $1,000 to $2,000/month for small to mid-sized setups, with enterprise deployments costing significantly more.
Swydo starts at $69/month with unlimited templates, which makes Funnel approximately 20 to 40 times more expensive, but targeting different use cases (enterprise data pipelines versus agency reporting).
The advantages included in the Funnel.io review are a large connector library covering 500+ marketing and advertising sources, powerful data cleaning and transformation capabilities that standardize metrics across platforms, compatibility with major BI tools and data warehouses, file import fallback for unsupported platforms using CSV uploads, and automated data quality checks.
The disadvantages of Funnel.io are expensive and unpredictable pricing that escalates with usage, a steep learning curve requiring data engineering knowledge, frequent complaints about missing or duplicated data in user reviews, limited native dashboards requiring external visualization platforms, and rigid cancellation policies with long-term commitments.
11. ReportGarden: Best Swydo Alternative for PPC & SEO Client Reports
ReportGarden is the best Swydo alternative for PPC and SEO client reports with template-driven dashboards and agency-focused workflows. ReportGarden is a marketing reporting platform that provides multi-channel dashboards, white-label client portals, and 1,000+ pre-built templates that matter because agencies need repeatable processes, fast onboarding, and professional outputs without extensive configuration.
ReportGarden offers 100+ integrations (Google Ads, Microsoft Ads, Facebook Ads, LinkedIn Ads, Google Analytics, Search Console, social platforms), native PPC reporting with automated data pulls, data blending across channels for unified views, custom widget creation for specific metrics, white-labeled client portals with independent access, templated reporting that reduces setup time, and scheduled PDF delivery.
ReportGarden prioritizes speed and template efficiency, which allows agencies to create reports quickly using standardized layouts.
Compared to Swydo, ReportGarden includes an extensive template library (1,000+ versus Swydo templates) and provides white-labeled portal access at the entry pricing level, while Swydo emphasizes drag-and-drop customization and the combined data sources feature.
Whatagraph enables AI summaries and advanced data organization, while ReportGarden focuses on fast deployment with pre-configured options. Both platforms target agencies, but ReportGarden optimizes for speed while Swydo provides more flexible widget customization.
ReportGarden pricing starts at $75/month for basic plans, scaling to higher tiers based on client count and feature requirements. Specific pricing details vary by configuration but remain significantly cheaper than enterprise platforms.
At $75/month entry, ReportGarden costs $9 more than the Swydo base ($69/month) but avoids per-source charges, which makes total costs comparable or lower for agencies with many data sources. Users benefit from unlimited dashboards under fair usage policies without credit restrictions.
The upsides, according to the ReportGarden review, include affordability compared to enterprise reporting platforms, fast onboarding with minimal training required, a large template library, white-label portal access included at lower price points, and straightforward pricing without complex credit systems.
The downsides of ReportGarden include limited AI-driven reporting and insights, less advanced data unification compared to platforms like Whatagraph, fewer enterprise features (governance, advanced security, API access), and basic customization that may not accommodate highly specialized reporting needs.
12. Octoboard: Best Swydo Alternative for Automated Web & Social Dashboards

Octoboard is the best Swydo alternative for automated web and social dashboards with scheduled PDF delivery and cloud data storage. Octoboard is a marketing analytics platform built for agencies and businesses that need automated reporting across websites, social media, advertising, and analytics platforms without manual data compilation.
Octoboard features 100+ integrations (Google Analytics, Google Ads, Facebook, Instagram, LinkedIn, Twitter, YouTube, SEO tools), automated PDF report generation with scheduled delivery, white-label branding with custom logos and domains, cloud data storage with historical retention, TV dashboard displays for office monitoring, and client portal access. Octoboard focuses on automating routine reporting tasks, reducing time spent on monthly deliverables.
Octoboard pricing utilizes a modular structure, allowing businesses to select and combine analytics packages. Marketing Analytics costs $18/month for 3 data sources (100 keywords, 20 SEO audits, automated reports, ChatGPT insights). PPC Data Analytics costs $24/month, supporting up to $12,000 monthly ad spend (multi-channel reporting, custom metrics, data warehouse access, Google Sheets export).
Octoboard Ecommerce Analytics costs $14/month for 500 orders or 1,000 emails (real-time transactions, shopping cart analytics, email marketing features). Web Analytics costs $17/month for 10,000 website events (real-time dashboards, IP to Business conversion, heatmaps, goal tracking).
The pros in the Octoboard review include automated PDF scheduling that eliminates manual report creation, white-label options at lower price tiers, cloud data storage for historical analysis, and TV dashboard functionality for office displays.
The cons of Octoboard are limited integrations compared to comprehensive platforms (100+ versus Swydo 32+), basic customization options that may not meet complex needs, occasional connector issues similar to other reporting tools, and fewer advanced features (AI insights, advanced data blending).
13. Reportei: Best Swydo Alternative for Fast Multi-Channel Reporting Templates
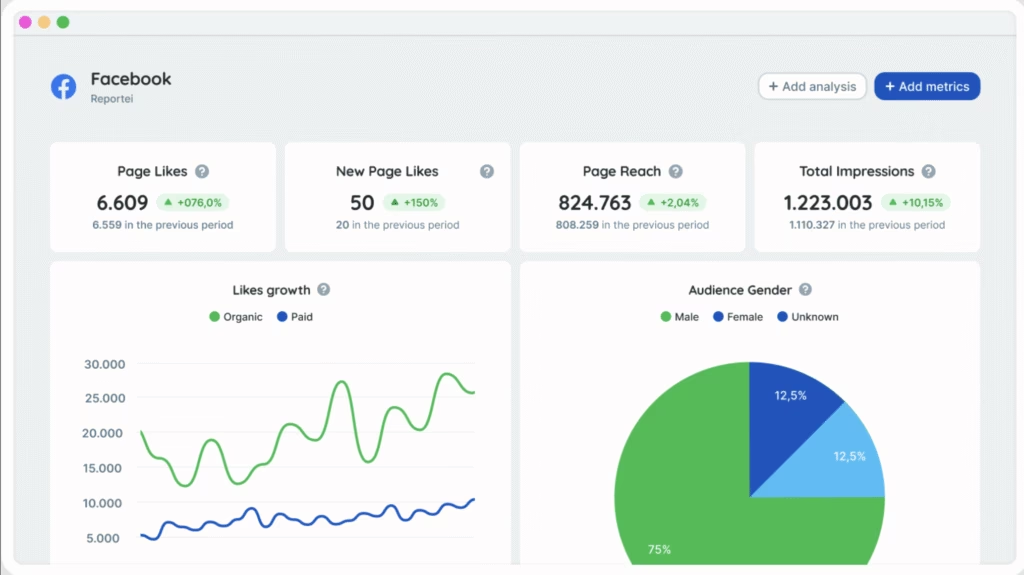
Reportei is the best Swydo alternative for fast multi-channel reporting templates with localized Brazilian market optimization and Portuguese language interface. Reportei is a reporting and dashboard platform that automates communication between marketing professionals and clients through branded visual reports, AI-generated insights, and project timeline tracking.
Reportei features 30+ integrations (Meta Ads, Instagram, Facebook, Google Ads, Google Analytics 4, LinkedIn, TikTok, YouTube, Google My Business, Search Console, Mailchimp, HubSpot, Hotmart, RD Station, Pipedrive), and AI-generated insights tailored for traffic management and Instagram optimization.
It offers a timeline function that tracks campaign events with date-stamped story blocks, customizable dashboards with visual layouts, automated report scheduling by frequency and channel, and Reportei Control for budget monitoring and performance alerts.
Compared to Swydo, Reportei offers a unique Timeline feature for project documentation and localized support for Latin American agencies, while Swydo provides more template options for cross-channel reporting and combined data sources. Reportei serves LATAM markets specifically with local payment options, language support, and regional platform integrations.
Reportei pricing starts at $29/month for 5 reports and dashboards, with additional plans at $45 and $89/month based on brand count and user requirements. Swydo base pricing at $69/month makes Reportei approximately $40 cheaper at the entry level, providing significant cost savings for small teams and solo consultants. The pricing advantage makes Reportei attractive for freelancers and boutique agencies managing limited client portfolios.
The benefits listed in Reportei reviews include fast setup without extensive training requirements, client-friendly visuals that non-technical stakeholders understand, a unique Timeline feature for campaign project documentation, localized interface and support for Portuguese-speaking users, and affordable pricing that enables profitability for small agencies.
The downsides of Reportei include limited deep SEO analysis beyond basic metrics, missing keyword research and technical audit capabilities, a lack of competitive benchmarking features, and restricted use beyond social and performance reporting contexts.
14. Better Reports: Best Swydo Alternative for eCommerce Analytics Reporting
Better Reports is the best Swydo Alternative for eCommerce analytics reporting with Shopify-native connectors and transactional analysis. Better Reports is a plug-and-play analytics platform that connects with Shopify and other ecommerce tools to provide real-time data analysis, custom report builders, and operational insights that matter because online retailers need revenue intelligence, product-level visibility, and inventory monitoring directly from store data.
Better Reports provides 20+ connectors (Shopify, Stripe, Xero, QuickBooks, Help Scout, SendGrid), Shopify-native architecture that unlocks sales, product, customer, and inventory data, visual dashboard creation with drag-and-drop builders, drill-down capabilities for product-level analysis, scheduled recurring reports to team inboxes or Google Sheets, and CSV/PDF export options.
Compared to Swydo, which focuses on aggregated marketing data and campaign performance, Better Reports concentrates on revenue intelligence, product-level analysis, and operational reporting across ecommerce workflows. Swydo serves marketing agencies tracking advertising metrics, while Better Reports serves Shopify merchants needing store-level visibility and financial segmentation. The platforms target different user bases with minimal overlap in core functionality.
Better Reports pricing varies by connector and transaction volume. Shopify-specific plans start at $19.90/month for Basic stores and reach $299.90/month for Shopify Plus accounts. Stripe-based pricing begins at $29.90/month for accounts with fewer than 500 transactions, scaling with usage volume. Other connectors (QuickBooks, Help Scout) follow similar modular pricing rules.
Compared to Swydo at $69/month flat rate, Better Reports costs up to 6 times less for basic ecommerce reporting, depending on store tier and connector usage.
The pros mentioned in the Better Reports review include deep Shopify capabilities with native data access, fast visual reporting without complex BI setup, responsive technical assistance for implementation issues, flexible pricing based on store size and connector needs, and real-time data visibility for operational decisions.
The cons of Better Reports are limited capabilities for marketing attribution beyond ecommerce transactions, higher costs for enterprise accounts with multiple connectors, a lack of advertising platform integration that Swydo provides, and restricted functionality outside ecommerce contexts.
15. Metrics Watch: Best Swydo Alternative for Email-Delivered Reports
Metrics Watch is the best Swydo alternative for email-delivered reports with automated scheduling and straightforward dashboard creation. Metrics Watch is a marketing reporting tool that emphasizes scheduled email delivery of performance reports directly to clients inboxes without requiring portal logins or dashboard access.
Metrics Watch features automated email scheduling with customizable frequencies (daily, weekly, monthly), dashboard creation with basic visualization options, integration with common marketing platforms (Google Analytics, Google Ads, Facebook Ads, social channels), and white-label branding options. The platform prioritizes simplicity in report delivery, focusing on email automation rather than interactive dashboards or advanced analytics.
Compared to Swydo, which provides both PDF delivery and interactive client portals, Metrics Watch emphasizes email-first reporting. Swydo offers more extensive customization and data source coverage, while Metrics Watch simplifies workflows for teams wanting automated email distribution without portal management. Agencies evaluate based on whether clients prefer emailed PDFs versus portal access to live dashboards.
Metrics Watch pricing starts at $49/month for the Startup and scales up to $399 for the Agency plan. At this beginning price point, Metrics Watch costs approximately $20 less than Swydo base pricing ($69/month) while providing fewer integrations and customization options.
The pros mentioned in the Metrics Watch review include straightforward email automation without portal complexity, simple setup for basic reporting needs, white-label branding for professional deliverables, and automated scheduling that eliminates manual sends.
The Metrics Watch cons include limited integrations compared to comprehensive platforms, basic customization that may not meet advanced needs, higher pricing relative to feature depth, and a lack of interactive dashboard capabilities that Swydo provides.
16. Reporting Ninja: Best Swydo Alternative for Google Ads & GSC Reporting
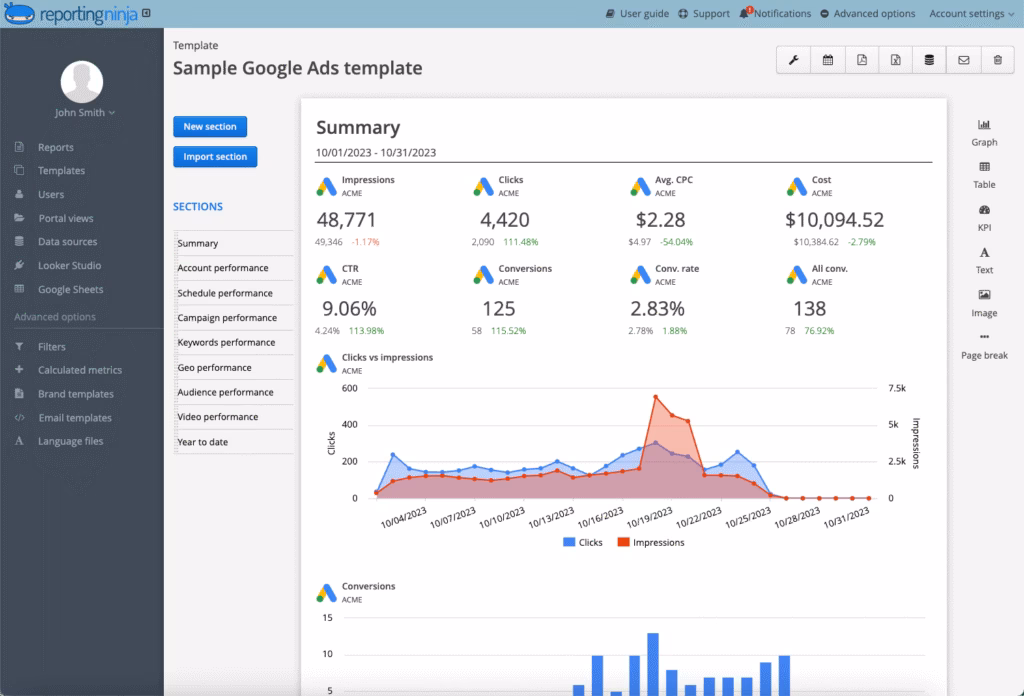
Reporting Ninja is the best Swydo alternative for Google Ads and Google Search Console reporting with all-inclusive connector pricing and transparent costs. Reporting Ninja is a marketing reporting platform built specifically for agencies managing Google advertising and search performance without per-data-source billing complexity.
Reporting Ninja features unlimited connectors on all plans (Google Ads, Google Analytics 4, Search Console, Facebook Ads, Instagram, LinkedIn), pre-built report templates optimized for PPC and SEO, white-label branding with custom domains, automated report scheduling, and client portal access. The platform emphasizes pricing transparency by including all connectors regardless of account count, avoiding the cost escalation model used by per-source platforms.
Compared to Swydo, Reporting Ninja offers flat-rate pricing that remains constant as agencies add clients and data sources. Swydo charges per data source after initial allocation, creating cost increases when client portfolios grow.
For agencies managing 20+ clients with multiple Google properties each, Reporting Ninja provides significant cost advantages. Swydo offers broader integration coverage beyond the Google ecosystem, while Reporting Ninja focuses specifically on Google platform reporting.
Reporting Ninja offers tier-based pricing starting at $20/month for the Starter plan (10 reports, 4 users), $40/month for Small (30 reports, 8 users), $70/month for Medium (70 reports, 12 users), and $120/month for Large (150 reports, 16 users), with all plans including every integration, feature, Looker Studio connector, and Google Sheets add-on without feature gating or usage-based charges.
The advantages of Reporting Ninja include predictable flat-rate pricing without per-source charges, unlimited connectors preventing cost escalation, focus on Google ecosystem optimization, transparent pricing structure, and cost savings for multi-client agencies.
The disadvantages of Reporting Ninja are limited integration coverage beyond Google platforms, a lack of advanced features (AI insights, complex data blending), basic template options compared to comprehensive platforms, and restricted functionality outside Google advertising and search contexts.
17. Reportz: Best Swydo Alternative for SEO Agency Dashboards
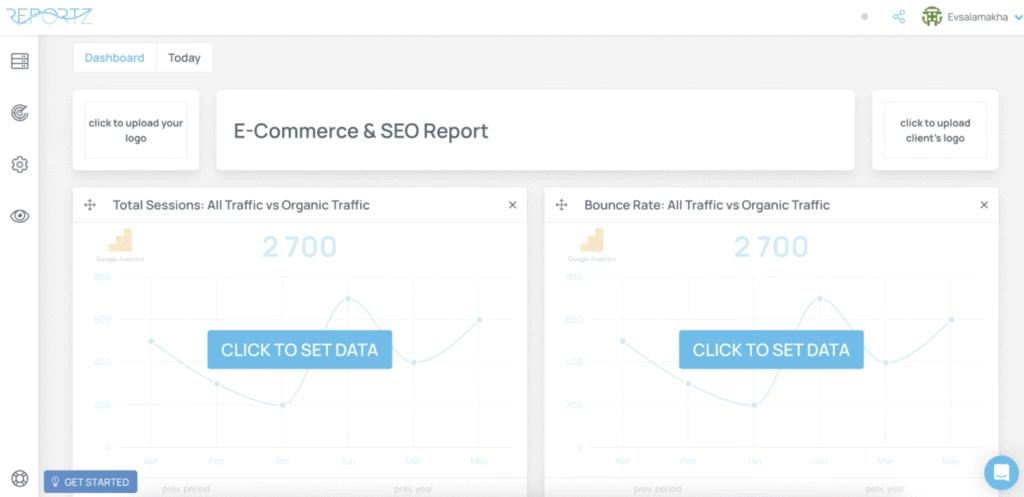
Reportz is the best Swydo alternative for SEO agency dashboards with rank tracking integration and search performance monitoring. Reportz is a marketing reporting tool designed for SEO agencies that need to combine rank tracking data with analytics metrics in client-facing dashboards.
Reportz features rank tracking capabilities for monitoring keyword positions, integration with Google Analytics and Search Console for organic performance data, social media reporting across major platforms, PPC data from Google Ads and Facebook Ads, white-label dashboards with agency branding, and automated report scheduling. The platform emphasizes SEO metrics alongside broader marketing data.
Compared to Swydo, Reportz includes native rank tracking features that Swydo lacks, requiring separate tools for position monitoring. Swydo provides broader advertising platform coverage and more template options, while Reportz optimizes specifically for SEO-focused agencies. Agencies prioritizing organic search performance evaluation prefer Reportz integrated tracking, while those focusing on paid media find Swydo more comprehensive.
Reportz pricing starts at $29.82/month for basic plans, scaling with client count and feature requirements. The entry price makes Reportz $40 cheaper than the Swydo base pricing ($69/month), which appeals to SEO agencies with budget constraints. However, feature depth beyond SEO requires evaluation against specific agency needs.
The pros noted in the Reportz review are integrated rank tracking without separate tool subscriptions, SEO-optimized dashboard templates, affordable entry pricing for small agencies, white-label options at lower price tiers, and a focus on organic search metrics.
The cons of Reportz include limited integrations beyond core platforms, basic customization compared to enterprise tools, fewer PPC-specific features than advertising-focused platforms, and restricted functionality outside SEO agency contexts.
18. Windsor.ai: Best Swydo Alternative for Multi-Touch Attribution Reporting
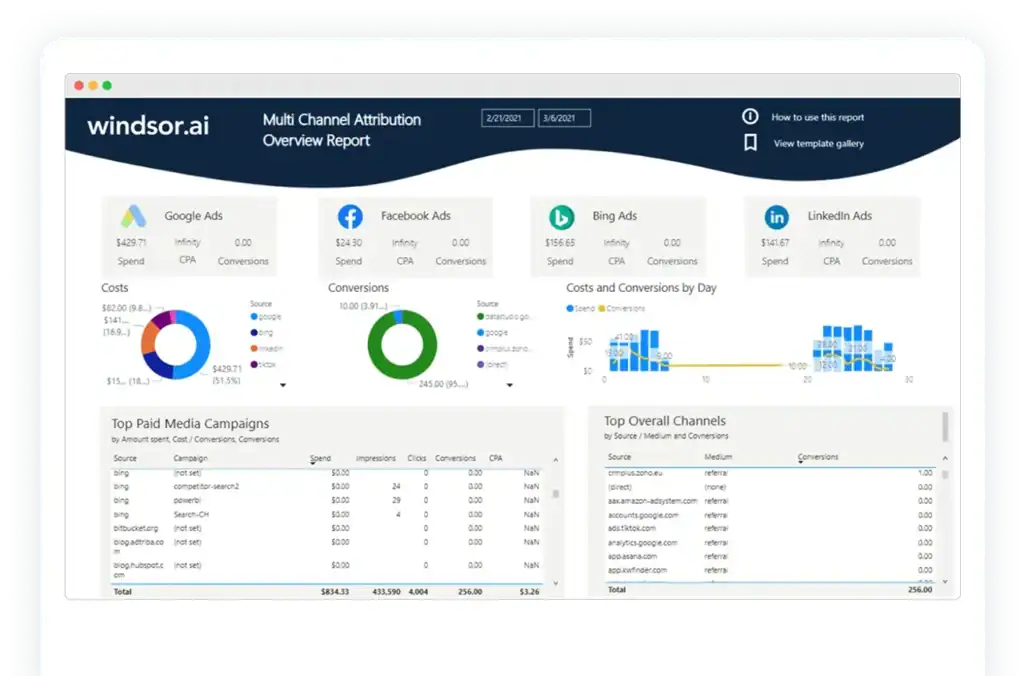
Windsor.ai is the best Swydo alternative for multi-touch attribution reporting with affordable ETL pipelines and flexible destination routing. Windsor.ai is a marketing data integration platform that connects advertising, analytics, and ecommerce platforms to destinations (Google Sheets, BigQuery, databases, BI tools) through automated ETL pipelines at lower price points than enterprise alternatives.

Windsor.ai provides automated data extraction and transformation, multi-touch attribution modeling to track conversion paths, destination flexibility supporting Google Sheets, BigQuery, Snowflake, BI platforms (Looker Studio, Power BI, Tableau), unlimited users, and external authentication on all plans, and free dashboard templates for quick setup. Windsor simplifies data collection for ROI analysis across marketing channels.
Compared to Swydo, which provides integrated dashboards and PDF delivery, Windsor.ai functions as data pipeline infrastructure requiring separate visualization tools. Swydo offers turnkey reporting solutions, while Windsor.ai enables custom analytics environments with data engineering control.
Agencies that want automated client reports prefer Swydo simplicity, while data-focused teams building custom analysis stacks benefit from Windsor flexibility.
Windsor.ai pricing includes Free plan (1 source, 1 destination, daily syncs), Basic at $23/month (3 sources, 5 destination tasks), Standard at $118/month (7 sources, hourly syncs, 75 accounts), Plus at $299/month (15 sources), and Professional at $598/month (14 sources, 15-minute syncs, 50M monthly rows). Swydo at $69/month base makes Windsor approximately $46 cheaper at entry, but requiring external visualization tools adds indirect costs.
The advantages in Windsor.ai reviews include responsive customer support with implementation assistance, ease of setup for basic integrations, seamless multi-platform connector breadth, affordable pricing compared to enterprise ETL platforms, and flexible destination options for custom workflows.
The disadvantages of Windsor.ai are a steep learning curve for non-technical users unfamiliar with ETL concepts, missing features on lower pricing tiers, interface limitations under heavy load or large dataset processing, and a requirement for separate BI tools, increasing the total cost of ownership.
19. Improvado: Best Swydo Alternative for Enterprise Marketing Analytics
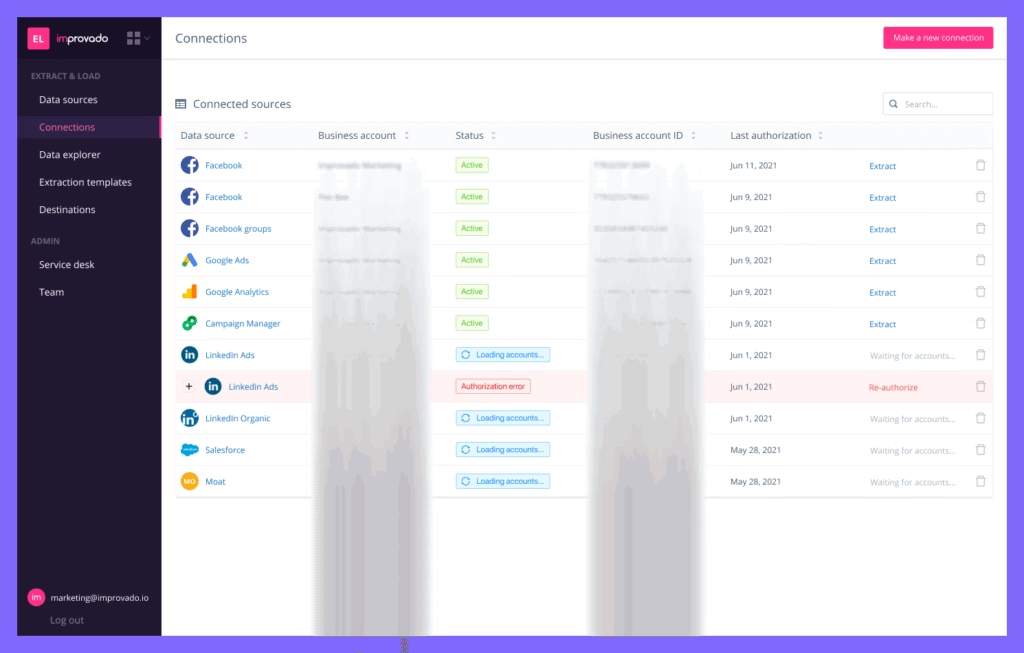
Improvado is the best Swydo alternative for enterprise marketing analytics with AI-powered automation and governance frameworks. Improvado is a marketing data platform built for enterprises and agencies with data teams that need to centralize, clean, and transform marketing data across hundreds of channels before pushing to BI tools or warehouses.
Improvado integrates with 500+ marketing and sales data sources, enables no-code and custom data transformations, enforces campaign governance with 250+ automated rules, includes AI Agents that automate routine analytics tasks, provides enterprise-grade security (SOC 2, HIPAA, GDPR, CCPA), and offers professional services for custom pipeline design.
Improvado acts as a comprehensive ETL pipeline infrastructure rather than a client-facing reporting tool.
Compared to Swydo, Improvado offers deeper data processing and governance but lacks polished client-ready dashboards. Swydo provides all-in-one workflows with integrated visualization, while Improvado requires pairing with Tableau, Looker Studio, or similar BI platforms.
Improvado suits enterprises managing complex pipelines and compliance-heavy industries, while Swydo targets agencies that need fast client deliverables without engineering teams.
Improvado pricing is not publicly listed and is quote-based, structured across Growth (up to 200M rows), Advanced (up to 600M rows), and Enterprise (up to 1B+ rows). Reviews suggest mid-to-high tier costs with credit-based add-ons for custom connectors, governance modules, and AI Agents.
Improvado entry costs likely start around $30,000+ annually, making Improvado at least 50 times more expensive than Swydo, but targeting enterprise data infrastructure rather than agency reporting.
The advantages outlined in Improvado reviews include extensive integrations covering specialized B2B and enterprise platforms, powerful ETL pipelines with complex transformation logic, enterprise security and compliance certifications, responsive high-tier support with dedicated account management, and AI-powered automation for analytics workflows.
The disadvantages of Improvado are steep learning curves requiring data engineering expertise, 2-month setup periods according to reviews, a lack of native client reporting requiring external BI tools, reliance on credit-based add-ons that raise total costs, and pricing complexity that obscures true implementation expenses.
20. Semrush: Best Swydo Alternative for Complete Marketing Insights
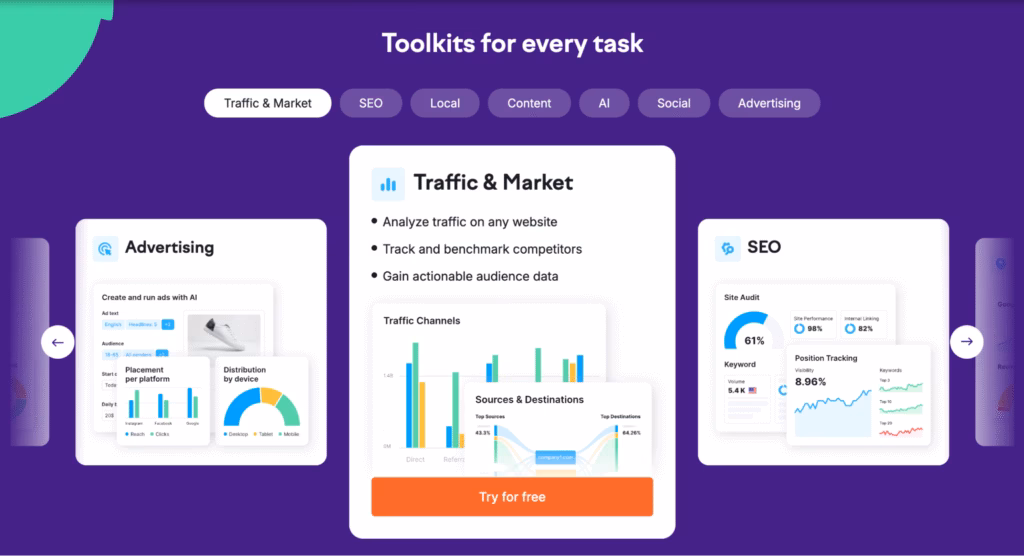
Semrush is the best Swydo alternative for comprehensive competitive analysis and integrated marketing tools. Semrush is an all-in-one digital marketing platform that combines SEO research tools, content marketing features, social media management, and advertising analytics with the My Reports suite that centralizes marketing data across 35+ sources into branded client deliverables.
Semrush includes Domain Overview for competitive intelligence, Keyword Magic Tool for search opportunity discovery, Position Tracking for daily rank monitoring, Site Audit for technical SEO analysis, Backlink Analytics for link profile evaluation, and My Reports for automated client updates. Semrush My Reports provides customizable templates for Google Analytics 4, Google Search Console, SEO, PPC, and social media with white-label design, automated scheduling, and AI-powered summaries highlighting key performance trends.
Compared to Swydo, Semrush reporting exists within a broader SEO and marketing intelligence suite rather than a standalone reporting focus. Swydo emphasizes automated PDF generation and dashboard simplicity, while Semrush provides reporting alongside keyword research, competitor analysis, and technical audits.
Agencies that are already subscribing to Semrush for SEO tools benefit from integrated reporting, while those needing only client deliverables without SEO research find Swydo more cost-effective and focused.
Semrush pricing starts at $139.95/month for Pro (5 projects, essential SEO tools), $249.95/month for Guru (15 projects, My Reports access, Content Marketing Toolkit), and $499.95/month for Business (40 projects, API access, extended limits). Advanced reporting features require the Guru tier minimum.
Swydo at $69/month base is $71 cheaper than Semrush Pro, but agencies need both SEO tools and reporting to find the consolidated value compelling, despite the higher costs.
The advantages reported in the Semrush review include robust competitor analysis not available in reporting-only tools, wide keyword coverage for SEO research, an integrated feature set reducing tool sprawl, a comprehensive backlink database, and My Reports automation for client deliverables.
The disadvantages of Semrush are higher overall costs, especially for advanced reporting tiers, traffic estimate inaccuracies according to user feedback, limited reporting access on lower-price plans forcing upgrades, reporting not being the primary platform focus compared to dedicated tools, and complexity that requires a learning curve for reporting features alongside SEO tools.
21. Looker Studio: Best Swydo Alternative for Custom Reporting
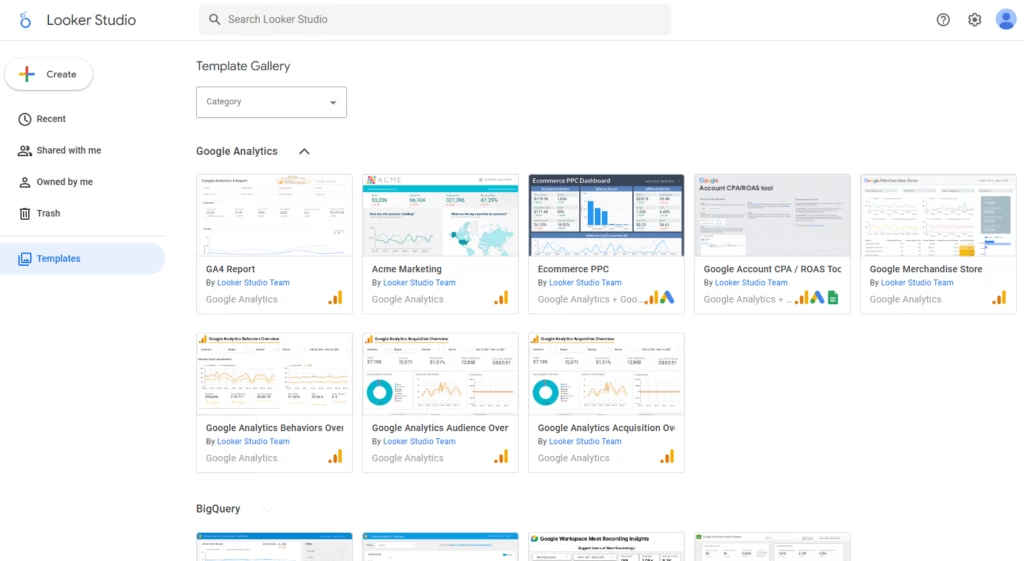
Looker Studio is the best Swydo alternative for custom reporting with Google ecosystem integration and free access. Looker Studio, formerly Google Data Studio, is a cloud-based business intelligence platform that connects to 800+ data sources and enables users to build dashboards with drag-and-drop design, report embedding, and advanced customization that matter because teams need flexible visualization without paying for licenses or credits.
Looker Studio features native integration with Google Analytics, Google Ads, Google Sheets, and BigQuery, a template library with 200+ pre-built dashboards, calculated fields for complex data modeling, AI-powered anomaly detection, community visualizations for extended chart types, and data blending across multiple sources.
Users assemble custom reporting stacks by connecting Looker Studio with third-party connectors (Supermetrics, Funnel, Windsor.ai), which expands coverage beyond Google-native data.
Compared to Swydo, which delivers ready-to-use dashboards with direct marketing integrations, Looker Studio offers more flexibility but requires higher technical skill and time investment. Swydo provides managed connectors with stable data sync, while Looker Studio requires configuration and often third-party connector subscriptions. Swydo emphasizes speed and client-ready outputs, while Looker Studio optimizes for customization and Google ecosystem efficiency.
Looker Studio is free to use. Looker Studio Pro costs $9/user/month for organizational ownership, IAM/SSO integration, 200 scheduled deliveries versus 1 on the free tier, and enhanced collaboration features. Enterprises requiring administration, audit logs, and technical support evaluate the Pro tier based on governance needs. Third-party connectors ($30 to $500/month) often exceed subscription costs, making total ownership more expensive than advertised.
Swydo at $69/month with integrated connectors provides more predictable costs than Looker Studio free tier plus connector subscriptions.
The advantages noted in the Looker Studio review include free access for unlimited users and reports, deep integration across Google products (Analytics, Ads, Sheets, BigQuery), advanced customization through calculated fields and community visualizations, a template library for quick starts, and no per-user or per-source licensing.
The disadvantages of Looker Studio are a steep learning curve requiring technical knowledge, limited support for beginners on the free tier, reliance on third-party connectors for non-Google sources, which add costs and complexity, performance issues with complex dashboards at scale, and manual configuration versus managed integrations.
22. Tableau: Best Swydo Alternative for Advanced Visual Analytics
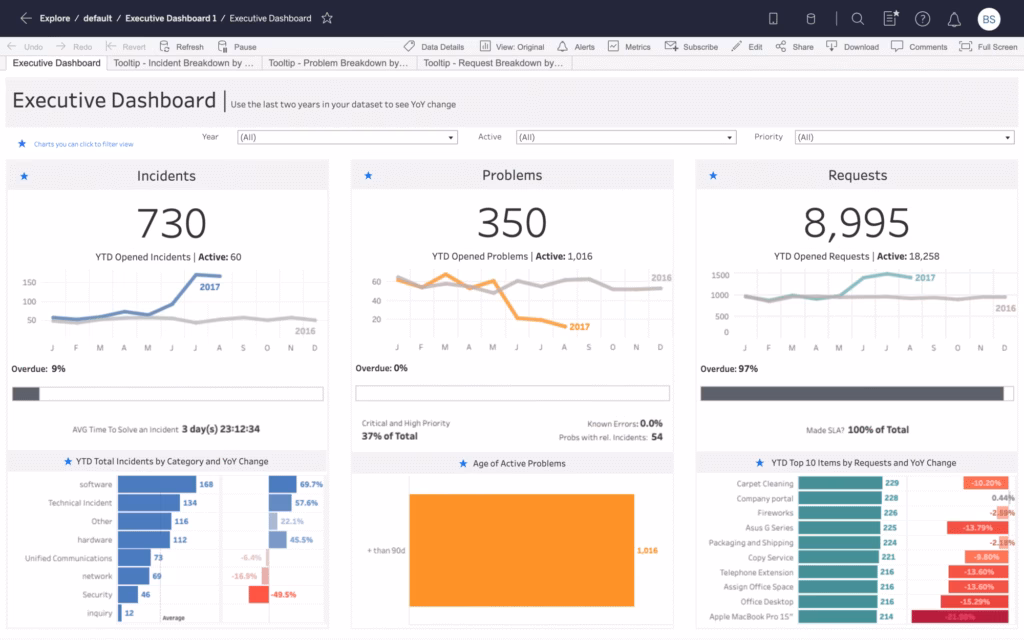
Tableau is the best Swydo alternative for advanced visual analytics with sophisticated exploration and interactive dashboards. Tableau is a data visualization and business intelligence platform owned by Salesforce that enables users to create complex, interactive dashboards through visual query interfaces and drag-and-drop workflows.
Tableau offers 5 core products (Tableau Desktop for development, Tableau Public for free public sharing, Tableau Server for on-premises deployment, Tableau Cloud for cloud hosting, Tableau Reader for viewing), live connections to databases (Oracle, AWS, Google Cloud SQL, Snowflake, Redshift), advanced visualization types beyond standard charts, data blending and preparation tools, statistical analysis functions, and mobile-optimized dashboards.
Compared to Swydo, which focuses on automating marketing channel reports with fixed widgets, Tableau delivers highly customizable analytics that extend to blended data and exploratory scenarios. Swydo prioritizes speed and simplicity in client reporting, while Tableau provides analytical depth for data exploration. Swydo serves agencies that need fast PDF deliverables, while Tableau suits analysts requiring flexible investigation tools beyond templated reports.
Tableau pricing starts with Tableau Public at $0 for public cloud publishing, Tableau Viewer at $15/user/month for read-only access, Tableau Explorer at $42/user/month for governed self-service, and Tableau Creator at $75/user/month for full authoring capabilities. Enterprise deployments typically cost $25,000 to $40,000 annually for 50-user organizations. Swydo at $69/month base (approximately $588 annually) makes Tableau Creator tier 15 times more expensive per user, reflecting enterprise scope versus agency reporting focus.
The upsides in Tableau reviews include industry-leading visual analytics capabilities, flexible data blending for complex analysis, an intuitive drag-and-drop interface accommodating non-technical users, extensive chart types and customization options, strong community support with free training resources, and scalability from individual analysts to enterprise deployments.
The downsides of Tableau are a steep learning curve despite an intuitive interface, high costs at scale when licensing many creators, performance issues with very large datasets, reliance on separate ETL tools for data preparation, and complexity overkill for simple monthly client reports.
23. Power BI: Best Swydo Alternative for Enterprise-Grade Reporting
Power BI is the best Swydo alternative for enterprise-grade reporting with cost-effective interactive analysis and Microsoft ecosystem integration. Power BI is a business intelligence and data visualization platform from Microsoft that connects to multiple data sources and transforms information into interactive dashboards and reports through data modeling, DAX calculations, and drill-through interactions.
Power BI features semantic models with relationships and calculations, interactive dashboards with drill-down navigation, Power Query for data transformation, DAX language for custom metrics, scheduled refresh automation, row-level security for governed access, embedding in apps and websites, and native integration with Microsoft 365, Azure, and SQL Server. Power BI provides AI-powered insights, natural language queries, and mobile apps for on-the-go monitoring.
Compared to Swydo, which emphasizes template-based client reporting with automated PDF delivery, Power BI focuses on interactive analysis with self-service exploration. Swydo provides marketing-specific integrations and agency workflows, while Power BI offers broader enterprise capabilities across departments.
Agencies that prioritize fast client reports prefer Swydo simplicity, while organizations that need internal analytics with Microsoft integration benefit from Power BI depth.
Power BI pricing includes a Free tier for desktop authoring and personal use, Power BI Pro at $10/user/month for publishing and collaboration, and Power BI Premium at $20/user/month for larger datasets and advanced features. Enterprise deployments range from $6,000 to $12,000 annually for 50-user organizations.
Swydo at $69/month makes Power BI significantly cheaper per user for organizations with existing Microsoft licensing, but agencies without Microsoft infrastructure find Swydo more focused and easier to implement.
The advantages mentioned in Power BI reviews include cost-effective plans with free desktop authoring, strong integration with Microsoft ecosystem (Office 365, Azure, Teams, SharePoint), AI-powered insights and natural language queries, extensive data modeling capabilities through DAX, an active community with free training resources, and frequent feature updates from Microsoft.
The disadvantages of Power BI are a steeper learning curve for advanced features (DAX, Power Query), performance limitations on the free tier with dataset size restrictions, less marketing-specific focus than dedicated agency tools, a requirement for premium tiers to access full collaboration features, and complexity that exceeds the needs for simple client deliverables.
24. Klipfolio: Best Swydo Alternative for Modular KPI Dashboards
Klipfolio is the best Swydo alternative for modular KPI dashboards with customizable data visualizations and technical flexibility. Klipfolio is a business intelligence platform designed for technical teams and data-savvy agencies that want flexible dashboards with deep customization and comfort with hands-on setup.
Klipfolio connects with 140+ data sources (Google Analytics, Facebook Ads, Salesforce, HubSpot, SQL databases), offers customizable “Klips” (widget components) with advanced chart editing, REST/SQL connectors for custom sources, white-label options with custom domains and themes, role-based access controls, SSO on higher tiers, automated data refresh scheduling, and client dashboard templates.
Compared to Swydo, Klipfolio provides more customization but requires more technical expertise. Swydo focuses on speed with ready-made templates and managed integrations, while Klipfolio suits teams wanting to build tailored dashboards with advanced queries.
Swydo simplifies multi-client reporting workflows through standardized approaches, while Klipfolio delivers broader flexibility for internal KPI tracking and data-centric teams willing to invest in setup time.
Klipfolio pricing starts at $140/month for 3 dashboards with unlimited users and 4-hour refreshes, scales to $220/month for 10 dashboards, $350/month for 20 dashboards, and $690/month for 40 dashboards with faster refresh and SSO. Agency plans start at $110/month for 5 clients, scaling to $1,025/month for 80 clients, with extra costs for white-labeling, custom domains, and near-real-time refresh.
At scale, Klipfolio costs significantly more than the Swydo $69/month entry, depending on client count and feature requirements.
The pros in the Klipfolio review include extensive integrations for diverse business platforms, highly customizable data visualizations with advanced chart options, flexible sharing through links, embeds, or scheduled delivery, strong security features, and unlimited users on dashboard plans.
The cons of Klipfolio are steep learning curves for custom queries, unreliable connectors with occasional sync failures according to reviews, slow load times with large datasets, limited pre-built templates compared to turnkey platforms, and expensive add-ons that raise costs for white-labeling and advanced features.
25. Porter Metrics: Best Swydo Alternative for GA4 & GSC Connectors
Porter Metrics is the best Swydo alternative for GA4 and GSC connectors with cross-channel data blending and BigQuery-powered analytics. Porter Metrics is a no-code marketing data warehouse platform that connects advertising, analytics, and ecommerce platforms to Looker Studio and Google Sheets through automated data pipelines.
Porter Metrics features 20+ marketing-focused integrations (Google Ads, Facebook Ads, Meta organic, Instagram, TikTok, LinkedIn, Google Analytics 4, Google Search Console, Shopify, HubSpot).
Porter provides automated data segmentation by date, channel, source, account, campaign, creative, UTM, and content, profit, and ROI metrics with COGS imports from Google Sheets. It offers real-time API and stored data switching for optimal freshness and speed, 100s of free dashboard templates for quick setup, and the ability to connect 100s of accounts with no performance slowdown.
Porter eliminates manual CSV downloads and provides live analytics that update continuously, transforming static reporting into dynamic data environments. The platform includes Google Sheets import functionality for blending budgets, goals, forecasts, annotations, and currency conversions with live marketing data.
Compared to Swydo, which provides integrated dashboards with PDF delivery, Porter Metrics functions as a data connector requiring Looker Studio or Google Sheets for visualization. Swydo offers turnkey reporting with managed templates, while Porter delivers cross-channel data blending with automated field mapping that reduces manual data preparation.
Swydo emphasizes client-ready outputs through its native interface, while Porter optimizes for marketers who prefer free visualization tools combined with powerful backend data infrastructure. Agencies managing multiple brands and campaigns benefit from the blended connection approach in Porter, while those wanting complete reporting solutions in one platform prefer the all-in-one structure in Swydo.
Porter Metrics pricing includes a Free forever plan (1 source, 1 destination, daily syncs), $15/month for 1 account (billed monthly), with pricing decreasing per account as volume increases. The platform charges per connected account (each Meta Ad account, GA4 property, Instagram Business Profile, Google Business Profile with 10 locations counting as 1 account, Shopify Store, HubSpot Account).
Swydo at $69/month base makes Porter Metrics significantly cheaper at $15/month for single-account setups, with costs remaining competitive as agencies scale. The free plan provides immediate access without credit card requirements, while Swydo requires paid subscriptions from the start.
The advantages outlined in the Porter Metrics review include a simple setup that eliminates daily CSV downloads, real-time data connections that update continuously, an extensive tutorial library with founder support via chat, email, and Slack, affordable pricing with transparent per-account costs, seamless integration with Google ecosystem tools (Looker Studio, Sheets), and free dashboard templates that accelerate implementation.
The disadvantages of Porter Metrics are limited to approximately 20 marketing-focused integrations compared to comprehensive platforms with 100+ sources, reliance on external visualization tools (Looker Studio, Google Sheets) rather than a native reporting interface, a steeper learning curve for non-technical users unfamiliar with data warehouse concepts, and pricing that scales with connected accounts rather than flat-rate structures.
26. Grow.com: Best Swydo Alternative for Business KPI Visualization
Grow.com is the best Swydo alternative for business KPI visualization with unlimited users and no-code data transformation. Grow is a full-stack business intelligence platform that combines ETL, data warehousing, and visualization into one easy-to-use system that matters because teams need accessible dashboards without technical barriers or per-user licensing costs.
Grow.com features 100+ data integrations (Google Ads, Facebook Ads, Salesforce, HubSpot, QuickBooks, Shopify, MySQL, PostgreSQL), unlimited user access on all plans without additional seat charges, drag-and-drop dashboard creation with customizable widgets, transformation apps that allow non-technical users to manipulate data without SQL knowledge, automated report scheduling and delivery, white-label branding options, mobile apps for iOS and Android, and Metric Builder for creating custom KPIs without code.
Grow includes Datasets for cleaning and merging data, real-time dashboard updates, goal tracking with progress indicators, role-based permissions for team governance, and data explorer functionality that empowers end users to analyze data independently.
Compared to Swydo, which focuses on marketing reporting with per-source pricing, Grow delivers full business intelligence capabilities with unlimited users and broader departmental coverage. Swydo provides pre-built marketing templates and automated PDF delivery optimized for agency client reporting, while Grow targets cross-functional teams requiring internal KPI dashboards for sales, finance, operations, and marketing together.
Swydo emphasizes fast client deliverables, while Grow prioritizes comprehensive data visualization for internal decision-making. Agencies needing external client reports prefer Swydo simplicity, while businesses requiring unified internal dashboards across multiple departments benefit from Grow’s collaborative model.
Grow.com pricing is custom and not publicly listed, with third-party sources indicating costs in the range of $10-$100 per month based on data volume and features. Grow uses data-based pricing rather than per-user charges, making costs predictable as teams scale. Reviews suggest mid-tier pricing around $50-$75/month for small businesses, with enterprise deployments costing more based on connector count and data warehouse storage needs.
The pros mentioned in the Grow.com review include unlimited users, eliminating per-seat costs, an easy-to-use interface accessible to non-technical staff, wide integration coverage beyond marketing, no-code transformation tools, responsive customer support, and excellent value for large teams.
The cons of Grow.com are non-transparent pricing that requires sales conversations, limited advanced BI capabilities compared to enterprise tools, occasional performance issues with large datasets, fewer marketing-specific templates, and complexity overkill for simple client reporting needs.
27. Geckoboard: Best Swydo Alternative for Real-Time Team Dashboards
Geckoboard is the best Swydo alternative for real-time team dashboards with TV display optimization and instant performance visibility. Geckoboard is a dashboard platform built for team leads and managers who need to share live KPIs across office screens and displays without a complex BI setup.
Geckoboard features 90+ integrations (Google Analytics, Salesforce, HubSpot, Zendesk, spreadsheets, databases), drag-and-drop dashboard builders with no coding required, Send to TV functionality for pairing with Smart TVs or PC sticks, real-time updates as frequent as every minute, customizable widgets with status indicators, automated sharing via email and Slack, and mobile-friendly designs.
Compared to Swydo, which emphasizes PDF report generation and multi-channel marketing analytics, Geckoboard focuses on real-time KPI monitoring and office display use cases. Swydo provides comprehensive data blending and client-facing reports, while Geckoboard delivers lightweight dashboards optimized for visual consumption on large screens.
Agencies that manage complex client reporting prefer Swydo depth, while teams prioritizing real-time motivation benefit from Geckoboard simplicity.
Geckoboard pricing starts at $29/month for Starter (1 dashboard), $125/month for Team (5 dashboards), $219/month for Team Plus (10 dashboards), and custom Enterprise pricing. All plans include unlimited users, with costs scaling by dashboard count. Swydo at $69/month makes Geckoboard $40 cheaper at entry, but with limitations. Nonprofits receive 20% discounts.
The pros cited in the Geckoboard review include excellent TV dashboard display, clean visualizations at a glance, fast setup, responsive support, unlimited users, and straightforward pricing.
The cons of Geckoboard are limited customization compared to full BI platforms, fewer integrations than comprehensive tools, occasional connector issues, higher costs for many dashboards, and missing advanced features like AI insights.
28. Adsbot: Best Swydo Alternative for Automated PPC Monitoring
Adsbot is the best Swydo alternative for automated PPC monitoring with AI-powered alerts and rule-based automation. Adsbot is a PPC optimization platform for Google Ads, Meta Ads, and TikTok Ads that provides 24/7 campaign monitoring, anomaly detection, and automated recommendations that matter because advertisers need proactive optimization without constant manual oversight.
Adsbot features real-time performance monitoring with instant alerts, Rule Engine for automated actions, anomaly detection, budget monitoring, competitor ads tracking through Brand Checker, keyword optimization recommendations, multichannel dashboard, prebuilt reporting templates, dynamic reports, and SEO insights.
Compared to Swydo, which aggregates data for visual reporting and PDF delivery, Adsbot focuses on active campaign management with automated rules and performance alerts. Swydo provides cross-channel reporting for client communication, while Adsbot delivers operational tools for optimization and budget protection. Agencies can use both together with Adsbot managing optimization and Swydo handling client reporting.
Adsbot pricing starts at $99/month for Basic, $199/month for Pro,and $499/month for Agency. A 14-day free trial provides full feature access.
The benefits noted in the Adsbot review include AI-powered real-time alerts preventing wasted spend, Rule Engine automation, comprehensive budget monitoring, competitor tracking, affordable pricing, and a 14-day free trial.
The downsides of Adsbot are limited platform coverage (Google Ads, Meta, TikTok only), less emphasis on client-facing reports, a newer platform with a smaller community, and insufficient depth for sophisticated attribution modeling.
29. HubSpot Marketing Hub: Best Swydo Alternative for CRM-Linked Reporting
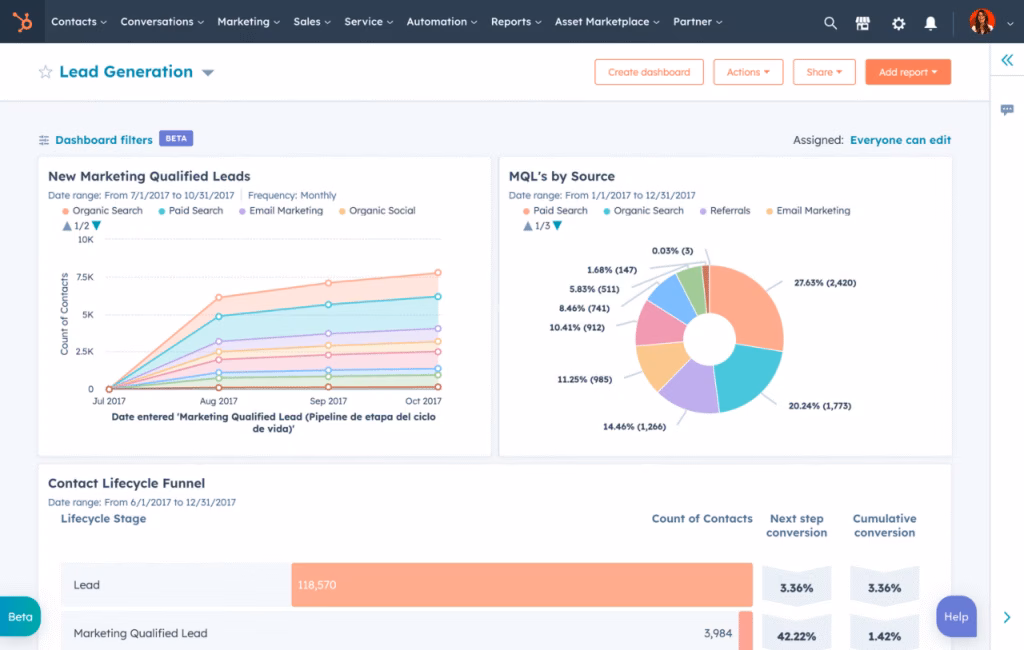
HubSpot Marketing Hub is the best Swydo alternative for CRM-linked reporting with unified customer platform integration and automated workflows. HubSpot Marketing Hub is a comprehensive marketing automation platform that combines lead generation, email marketing, landing pages, analytics, and CRM data. It matters because businesses need attribution tracking from first touch to closed revenue.
HubSpot Marketing Hub features 1,800+ integrations, email automation with workflows, landing page and form builders, social media management, blogging with SEO optimization, A/B testing, lead scoring, attribution reporting, AI-powered content creation through Breeze, and native CRM integration. Professional and Enterprise tiers include advanced automation, ABM tools, custom behavioral tracking, multi-touch attribution, and API access.
Compared to Swydo, which aggregates marketing data for visual reporting, HubSpot provides full marketing execution capabilities alongside analytics. Swydo focuses on data visualization and PDF generation, while HubSpot delivers end-to-end marketing operations.
Agencies using HubSpot benefit from native reporting but pay significantly more for the complete platform.
HubSpot Marketing Hub pricing starts at €10/month per seat (€20/month regular price, special Starter offer) for Starter (Customer Platform bundle, 1,000 marketing contacts, 500 HubSpot Credits, removes HubSpot branding from forms and emails), €880/month for Professional (includes 3 Core Seats, 2,000 contacts, 3,000 HubSpot Credits, omni-channel automation, advanced personalization, plus €2,930 required one-time onboarding fee), and custom pricing for Enterprise.
According to the HubSpot review, pros include unified CRM and marketing data, comprehensive attribution to revenue, powerful automation workflows, extensive integrations, removal of HubSpot branding on paid plans, and enterprise scalability.
The cons of HubSpot are expensive pricing, mandatory onboarding fees, required annual commitments, contact-based pricing that escalates, a steep learning curve, and overkill complexity for reporting-only needs.
30. Similarweb: Best Swydo Alternative for Competitor Traffic Insights
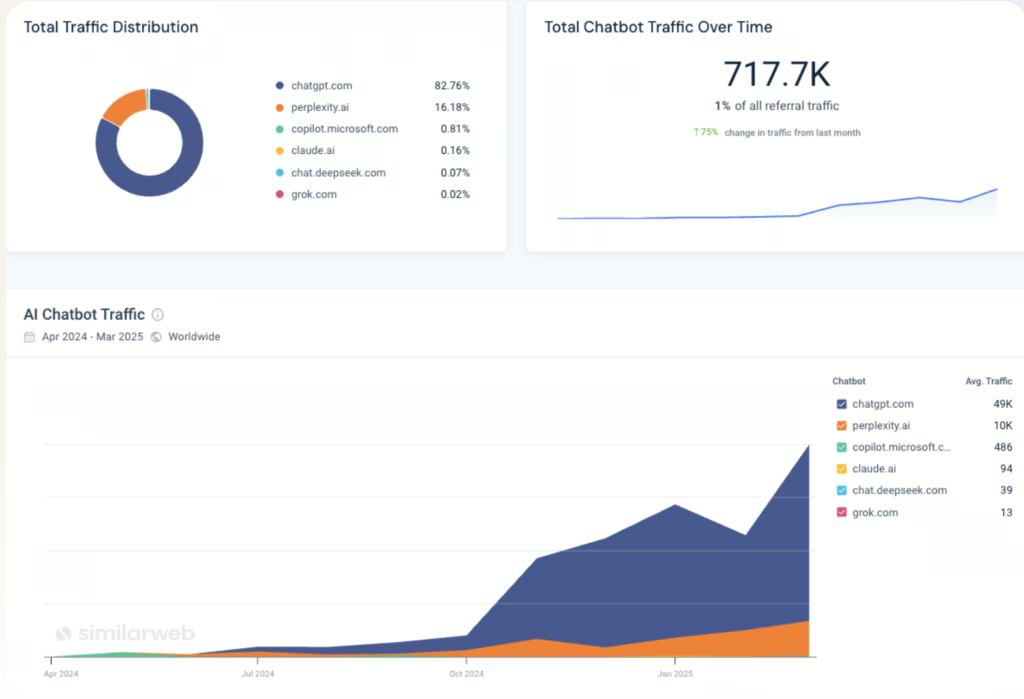
Similarweb is the best Swydo alternative for competitor traffic insights with comprehensive digital intelligence and market research. Similarweb is a digital data platform that provides website traffic analytics, competitive benchmarking, audience demographics, and industry analysis that matters because businesses need market intelligence beyond their own analytics.
Similarweb features traffic analysis for millions of websites, audience demographics, competitor analysis with side-by-side comparisons, keyword research, referral source identification, market research across industries, app intelligence, conversion analysis, AI chatbot traffic tracking, and historical data spanning months to years. The platform covers over 1 billion websites, 8 million apps, and 5 billion search terms.
Compared to Swydo, which consolidates first-party data for reporting, Similarweb provides third-party competitive intelligence for websites that users don’t own. Swydo delivers owned-channel performance tracking, while Similarweb enables market research and competitor monitoring. These platforms complement rather than compete.
Similarweb pricing ranges from $125/month for Competitive Intelligence to $540/month for Competitive Intel, SEO & Ads. Enterprise plans start around $14,000/year. Swydo at $69/month makes Similarweb more expensive, serving entirely different functions.
The pros mentioned in the Similarweb review are unmatched competitive intelligence, global coverage across millions of websites, industry benchmarking, multiple use cases beyond marketing, a free version for basic insights, and AI traffic tracking.
The cons of Similarweb are expensive pricing that is prohibitive for small businesses, data accuracy issues for smaller websites, delayed updates, advanced features locked behind high tiers, geographic add-ons increasing costs, and complexity requiring learning investment.
31. Ahrefs: Best Swydo Alternative for Link & Keyword SEO Reporting
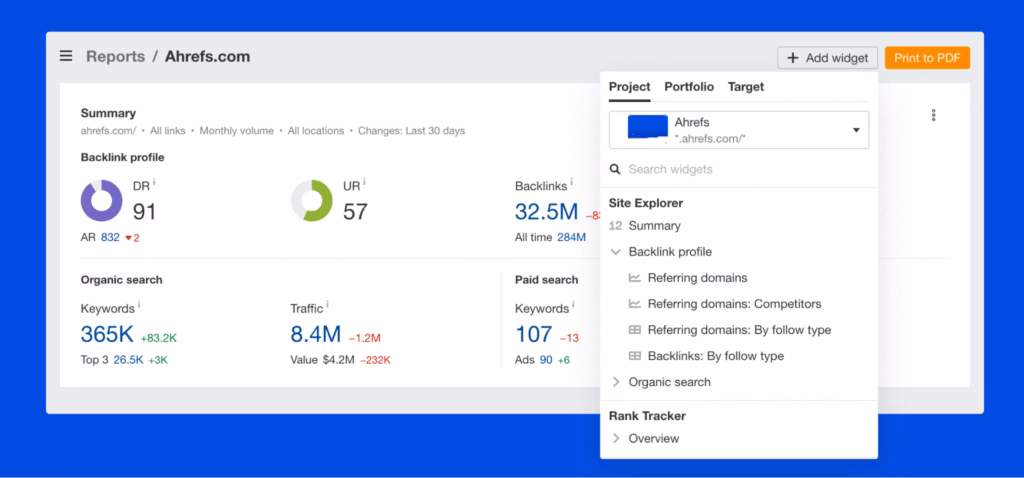
Ahrefs is the best Swydo alternative for link and keyword SEO reporting with comprehensive backlink analysis and organic search intelligence. Ahrefs is an SEO toolset that provides backlink monitoring, keyword research, rank tracking, competitor analysis, site audits, and content exploration.
Ahrefs features Site Explorer for backlink analysis, Keyword Explorer for search opportunities, Rank Tracker for position monitoring, Site Audit for technical issues, Content Explorer for top-performing content, competitive analysis tools, the most active web crawler with 8 billion pages daily, historical data, and API access on higher plans.
Compared to Swydo, which aggregates marketing metrics for reporting, Ahrefs provides specialized SEO research and analysis tools. Swydo delivers cross-channel performance tracking, while Ahrefs focuses exclusively on organic search and backlinks.
Ahrefs pricing starts at $129/month for Lite, $249/month for Standard, $449/month for Advanced, and $1499/month for Enterprise. Compared to Swydo, Ahrefs is more expensive, with additional costs due to stricter usage limits via a credit-based system on lower-tier plans.
The pros mentioned in the Ahrefs review include an extensive backlink database, comprehensive keyword research, powerful competitor analysis, detailed site audit, and data with frequent updates.
The cons are expensive pricing for small agencies, credit system complexity, rank tracking limitations (positions above #100 no longer tracked), traffic estimates sometimes inaccurate, lack of advanced features on entry plans, and annual commitments for discounts.
32. SE Ranking: Best Swydo Alternative for Rank Tracking Reports
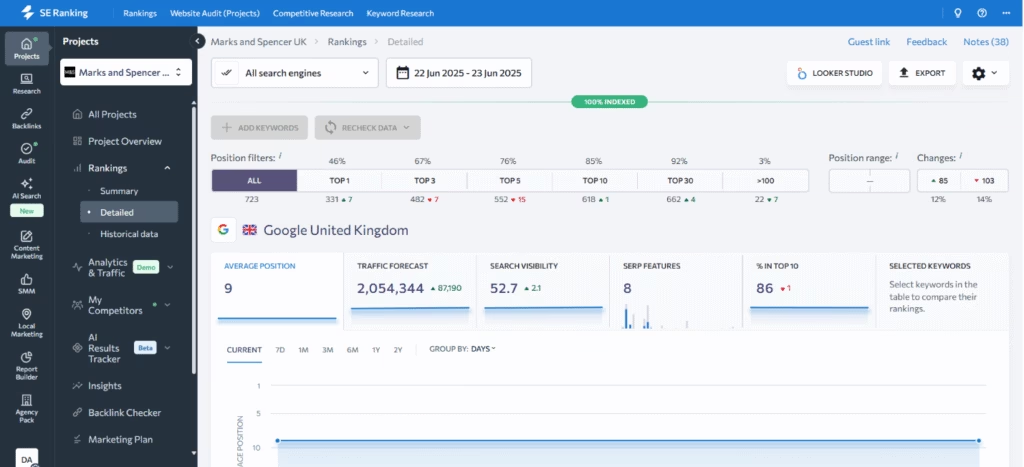
SE Ranking is the best Swydo alternative for rank tracking reports with comprehensive keyword monitoring and white-label client access. SE Ranking is an all-in-one SEO platform that provides keyword rank tracking, competitor analysis, website audits, backlink monitoring, and automated reporting for agencies that need cost-effective SEO tools with white-label capabilities.
SE Ranking features daily keyword rank tracking, competitor tracking for up to 10 competitors, website audit with 120+ checks, backlink checker, keyword research tool, marketing plan functionality, white-label reports, automated scheduling, rank tracking API, and Google Search Console analytics.
Compared to Swydo, which aggregates multi-channel marketing data, SE Ranking focuses specifically on SEO metrics with deeper rank tracking capabilities. Swydo provides high-level SEO data alongside advertising platforms, while SE Ranking delivers specialized rank monitoring with competitor comparison.
SE Ranking pricing starts at $65/month for Essential, $119/month for Pro, and $259/month for Business. Annual subscriptions provide 20% discounts. All plans include unlimited users and reports. The starting price in Swydo is comparable to the SE Ranking Essentials plan.
The pros noted in the SE Ranking review include affordable pricing compared to enterprise SEO tools, unlimited users and reports, comprehensive white-label options, daily rank tracking, website audit with actionable recommendations, and straightforward pricing.
SE Ranking cons are a less extensive backlink database, occasional data discrepancies, slower interface performance with large projects, limited advanced features, missing some integrations, and a less intuitive UI.
33. SpyFu: Best Swydo Alternative for Competitor PPC & SEO Reporting
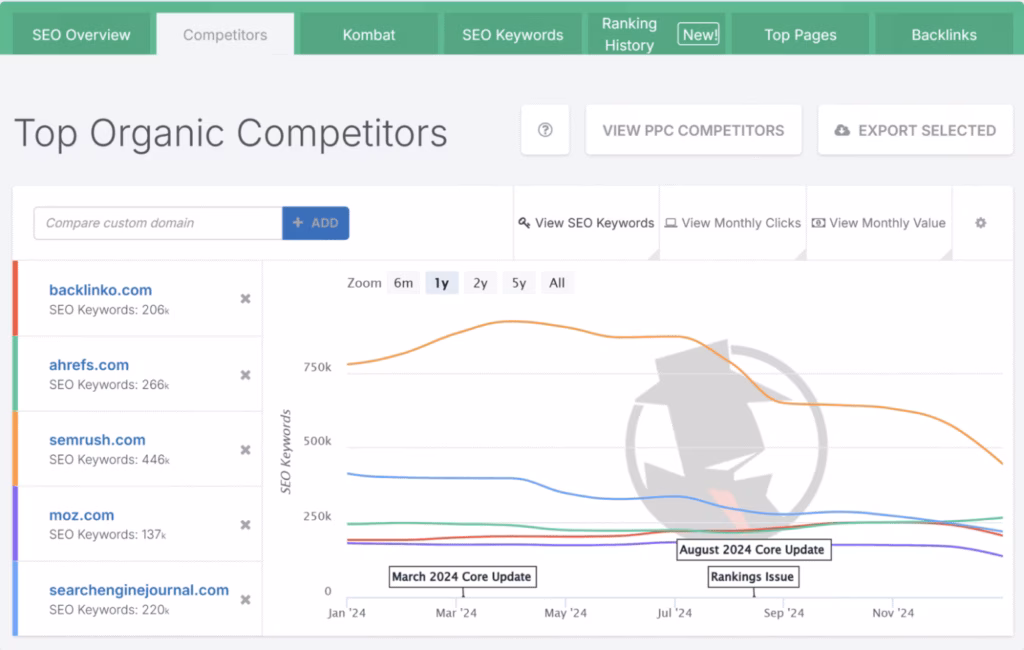
SpyFu is the best Swydo alternative for competitor PPC and SEO reporting with historical advertising intelligence and budget analysis. SpyFu is a competitive research platform that reveals competitors’ most profitable keywords, ad copy variations, and SEO strategies that matter because marketers need intelligence on competitor tactics beyond their own campaign performance.
SpyFu features competitor domain analysis showing every organic keyword and paid ad going back 15+ years, PPC research revealing ad copy and bidding strategies, keyword research with profitability indicators, rank tracking, backlink analysis, SERP analysis, AdWords Advisor, shared keyword discovery, and unlimited data export.
Compared to Swydo, which reports on owned campaign performance, SpyFu provides competitive intelligence for campaigns that users don’t manage. Swydo aggregates first-party data for client reporting, while SpyFu enables spy research on competitor strategies. These platforms complement rather than compete, with SpyFu informing strategy and Swydo tracking execution.
SpyFu pricing starts at $39/month for Basic (unlimited data access, 10,000 sales leads, 5,000 keyword tracking), $79/month for Professional (unlimited leads, 15,000 keywords), and $299/month for Team (40,000 keywords, custom reports, API access). All plans include unlimited searches.
The advantages included in the SpyFu review are extensive historical advertising data (15+ years), competitor keyword and ad copy intelligence, affordable pricing, unlimited searches, PPC-specific insights, and a straightforward interface.
The disadvantages of SpyFu are data accuracy limitations with estimates, a focus on Google search primarily, limited international coverage, fewer integrations, a smaller backlink database, and less useful for non-competitive research.
34. Crayon: Best Swydo Alternative for Competitor Intelligence Dashboards
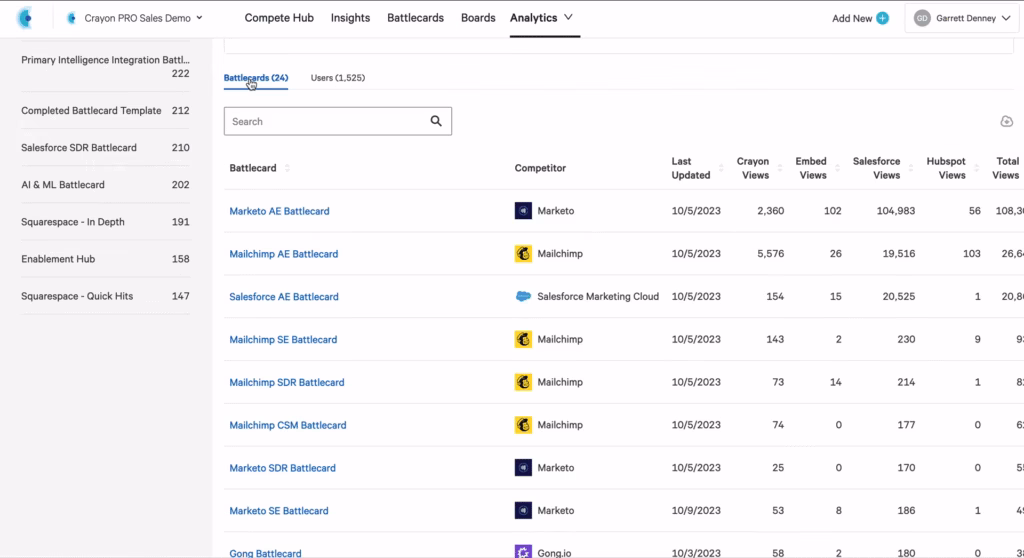
Crayon is the best Swydo alternative for competitor intelligence dashboards with AI-powered competitive tracking and battlecard creation. Crayon is a market and competitive intelligence platform that monitors competitor digital activities and creates sales battlecards that matters because go-to-market teams need structured competitive intelligence beyond marketing metrics.
Crayon features AI-powered competitive tracking monitoring competitor websites, social media, reviews, job postings, and financial reports, automated alerts for competitor changes, news aggregation, battlecard builder, competitive intelligence hub, Slack integration, win-loss analysis, and reporting dashboards.
Compared to Swydo, which reports owned marketing performance, Crayon monitors external competitive activities. Swydo aggregates first-party campaign data, while Crayon tracks third-party competitive signals. These platforms serve non-overlapping use cases within different organizational functions.
Crayon pricing is custom, with third-party sources indicating enterprise costs starting around $30,000-$60,000 annually. Pricing scales with tracked competitors, team seats, and intelligence volume. Swydo at $69/month ($828 annually) makes Crayon approximately 40 to 70 times more expensive, targeting enterprise competitive intelligence programs.
According to the Crayon review, the pros include comprehensive competitive tracking across channels, AI-powered filtering, battlecard creation supporting sales teams, team collaboration features, Slack integration, and win-loss analysis connecting intelligence to revenue.
The cons of Crayon are expensive enterprise pricing, setup complexity requiring dedicated resources, data overload without proper filtering, limited value without active competitive programs, steep learning curve, and significant investment beyond reporting requirements.
35. Kompyte: Best Swydo Alternative for Automated Competitive Monitoring
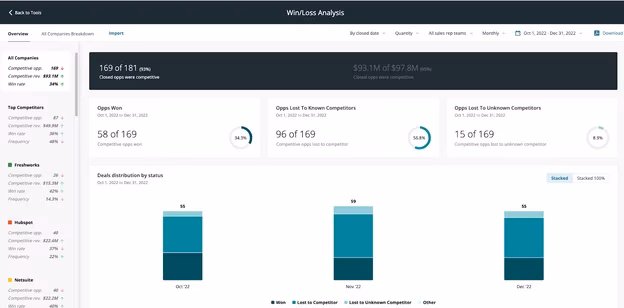
Kompyte is the best Swydo alternative for automated competitive monitoring with real-time competitor tracking and sales battlecard management. Kompyte is a competitive intelligence automation platform that tracks competitor websites, advertising, social media, and content changes that matters because organizations need scalable competitive monitoring without manual research overhead.
Kompyte features automated website monitoring, advertising tracking across Google, Facebook, and display networks, SEO monitoring, social media tracking, email capture, review monitoring from G2 and Capterra, battlecard builder, Slack and Teams integration, automated alerting, and competitive dashboards. Kompyte Autopilot uses AI to surface actionable intelligence, with Salesforce integration for CRM workflows.
Compared to Swydo, which consolidates owned marketing performance, Kompyte monitors external competitive activities. These platforms address different organizational needs with minimal functional overlap.
Kompyte pricing is custom and enterprise-focused, with industry sources suggesting pricing starts around $20,000-$40,000 annually for mid-sized implementations. Swydo at $69/month ($828 annually) makes Kompyte approximately 25 to 50 times more expensive, targeting enterprise competitive intelligence automation.
The upsides included in the Kompyte review are comprehensive automated monitoring, real-time alerts enabling fast response, battlecard integration, Salesforce integration, AI-powered insights, and scalable tracking of many competitors.
The downsides of Kompyte are expensive enterprise pricing, complexity requiring dedicated resources, data volume overwhelming without governance, limited value without active competitive programs, implementation requiring several weeks, and focus on monitoring rather than marketing analytics.
36. Contify: Best Swydo Alternative for Market and Competitor Intelligence Feeds

Contify is the best Swydo alternative for market and competitor intelligence feeds with AI-powered news aggregation and customizable intelligence delivery. Contify is a market and competitive intelligence platform that automatically collects, curates, and delivers relevant news and insights from millions of sources that matters because strategic teams need organized external intelligence without manual monitoring.
Contify features AI-powered content discovery from 500,000+ sources including news sites, regulatory sites, patent databases, financial reports, and social media, customizable intelligence topics, automated newsletters, competitive dashboards, news alerts, sentiment analysis, collaboration tools, taxonomy management, API access, and white-label reporting.
Compared to Swydo, which consolidates owned marketing data, Contify aggregates external market intelligence for strategic decision-making. Swydo reports on campaign execution, while Contify monitors industry trends, regulatory changes, and market developments. These platforms address entirely different organizational functions.
Contify pricing is custom and enterprise-focused, with third-party sources indicating costs starting around $15,000-$30,000 annually for basic implementations, scaling to $50,000+ for comprehensive deployments. Swydo at $69/month ($828 annually) makes Contify approximately 20 to 60 times more expensive, serving strategic intelligence functions.
The pros highlighted in the Contify review are comprehensive source coverage, AI-powered curation reducing manual monitoring, customizable intelligence topics, automated newsletter delivery, collaboration features, and white-label capabilities for consulting firms.
The cons are expensive enterprise pricing, content relevance varying despite AI curation, overwhelming information volume without proper management, limited value without active intelligence consumption programs, significant implementation requiring configuration, and focus on external intelligence rather than marketing analytics.
Why do People Seek Alternatives to Swydo Tool?
People seek alternatives to Swydo because Swydo imposes per-data-source pricing that scales unpredictably with client portfolios, lacks advanced AI-powered insights and analytics, struggles with incomplete metric coverage from advertising platforms, and receives criticism for data accuracy inconsistencies.
Users report that Swydo features lag in real-time refresh capabilities, combined data visualization before May 2025 update, and long-term trend analysis compared to comprehensive platforms.
Swydo reviews cite per-source billing complexity that creates surprise cost increases when agencies add clients, missing metrics from Facebook Ads and Google Ads that require workarounds, data discrepancies between Swydo reports and native platform numbers, and absence of AI-driven insights that competitors provide.
Agencies migrate from Swydo when pricing escalates beyond budget expectations, when data reliability issues damage client trust, when feature limitations prevent advanced reporting needs, or when they outgrow template-based simplicity requiring more sophisticated analytics.
What to Look for in a Swydo Alternative?
A Swydo alternative needs to replace or extend automated reporting, dashboard visualization, and client delivery workflows that Swydo provides. An ideal alternative offers deep integrations with marketing platforms through native connectors or API access, flexible report customization through drag-and-drop builders or code, transparent pricing structures that scale predictably with usage, reliable data accuracy that matches platform native reporting, and white-label branding for client-facing deliverables.
Why is Search Atlas the Best Swydo Alternative?
Search Atlas is the best Swydo alternative because it replaces fragmented reporting stacks with unified platforms that automate reporting, SEO optimization, and technical execution for 2026. Search Atlas includes AI-powered report generation through OTTO SEO agent, daily rank tracking without separate subscriptions, white-label dashboards with branded client portals, comprehensive technical audits that identify issues automatically, backlink analysis with link tracking, and local SEO heatmaps showing geographic performance, all under one plan with no per-connector fees or credit restrictions.
Agencies choose Search Atlas because it reduces tool switching between reporting platforms and SEO tools, cuts manual labor through Atlas Brain and OTTO that actually execute optimizations, and improves visibility across every SEO and GEO touchpoint (technical, on-page, off-page, local, content) that marketing reporting platforms cannot address.
User reviews confirm that Search Atlas eliminates the need for multiple subscriptions (reporting tool + rank tracker + audit tool + backlink checker), saves hundreds of dollars monthly compared to tool stack costs, and provides deeper insights through integrated SEO data alongside marketing metrics.
Start a free 7-day trial with Search Atlas to see how it transforms fragmented reporting and separate SEO tools into scalable, AI-automated operations that Swydo and other reporting-only platforms cannot handle.


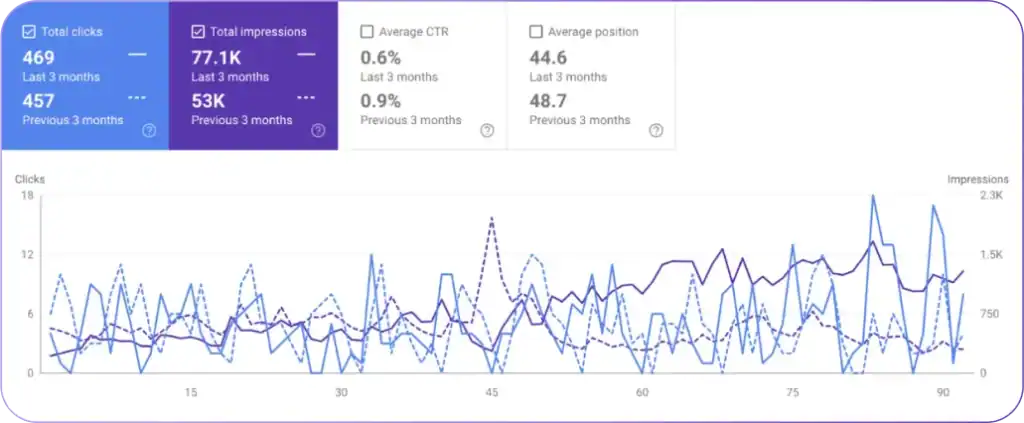
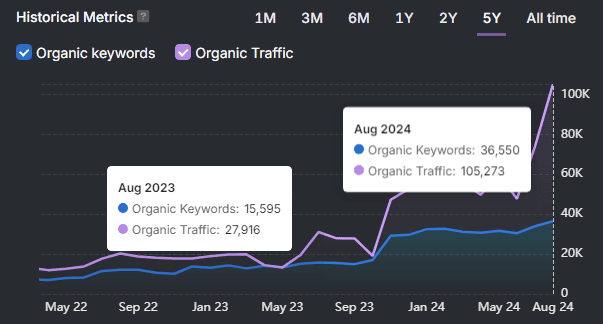
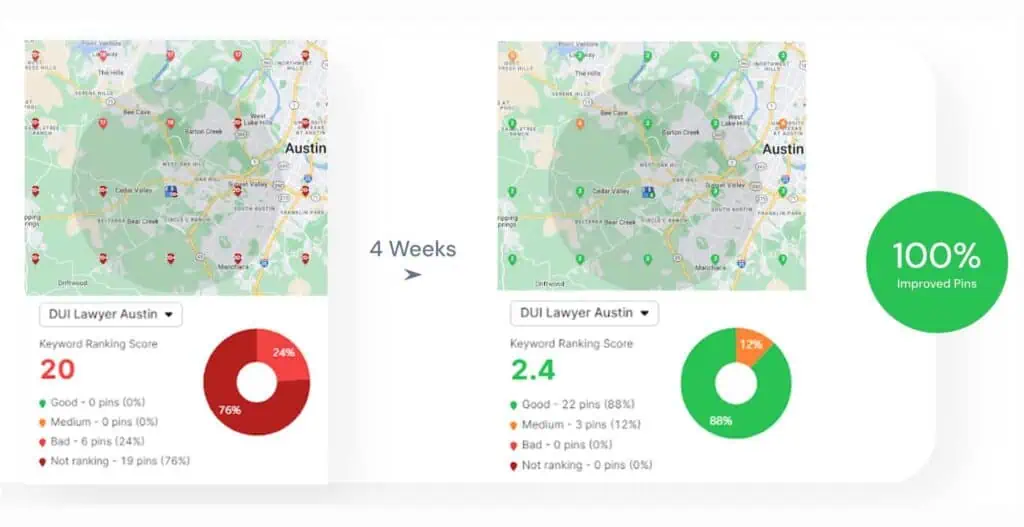
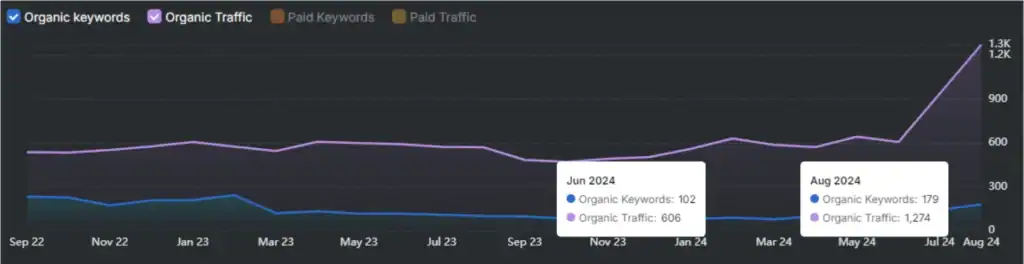